What is “Navi2”?
It is the code-name of the new AMD GPU, the 2nd generation RDNA (Radeon DNA) GPU arch(itecture) that itself replaced “Vega” / last of the GCN arch(itecture). Unlike the original Navi that was a mid-range GPU – this is the very much expected “big Navi” top-end GPU designed to battle nVidia’s finest 3000-series GPUs.
Navi/RDNA arch brought big changes from Vega/GCN and Navi2 has been enhanced and optimised from Navi1 adding more features:
- Ray-Tracing (RT) Cores – similar to nVidia’s Turing/Ampere cards
- Infinity Cache – 128MB
- Smart-Access Memory – PCIe BAR re-sizeing
- 6900XT has Navi21 XT top-end chip with all CUs enabled and speed binned
Unlike Vega1/2 GPUs that perhaps were very much compute focused – Navi1/2 seem to be more gaming focused with the few compute features already introduced: reduced workgroup size matching nVidia (32), increased work-group sizes (1024). It is likely that AMD will launch HBM2 professional cards and hopefully Navi versions with tensor units (TSX) or matrix multiplicators (tuMMA).
See these other articles on GP-GPU performance:
- ExtremeTech
- SiSoftware
Hardware Specifications
We are comparing the top-range Radeon with previous generation cards and competing architectures with a view to upgrading to a top-range high performance design.
| GP-GPU Specifications | AMD Radeon 6900XT (Navi2X) | AMD Radeon 5700XT (Navi1) | nVidia 3090 (Ampere) | nVidia 2080TI (Turing) | Comments | |
| Arch / Chipset | RDNA2 / Navi 21 XT | RDNA1 / Navi 10 | Ampere / GA102 / SM8.6 | Turing / GT102 / SM7.5 | The 2nd of the Navi cores | |
| Cores (CU) / Threads (SP) | 80 / 5,120 [+2x] | 40 / 2,560 | 82 / 10,496 | 68 / 4,352 | Twice as many CU as Navi1 | |
| Wave/Warp Size | 32 | 32 | 32 | 32 | Wave size now matches nVidia. | |
| Speed (Min-Turbo) (GHz) |
1.825 (2.250) | 1.6 (1.755) | 1.4 (1.78) | 1.35 (1.635) | 40% faster base and 20% turbo than Vega1. | |
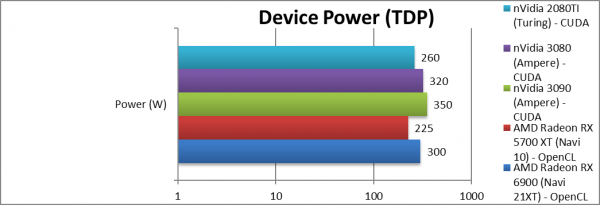
| Power (TDP) | 300W [+33%] | 225W | 350W | 260W | Power has only increased by 33% | |
| ROP / TMU | 128 / 320 [+2x] | 64 / 160 | 112 / 328 | 88 / 272 | 2x increase in ROP/TMU. | |
| Ray-Tracing (RT) |
80 | none | 82 | 68 | Navi2 brings 80 RT cores like nVidia. | |
| Shared Memory (kB) |
64kB | 64kB | 48kB / 96kB per SM | 48kB / 96kB per SM | No change in shared memory. | |
| Constant Memory (GB) |
8GB | 4GB | 64kB dedicated | 64kB dedicated | No dedicated constant memory but large. | |
| Global Memory (GB) |
16GB GDDR6 16Gbps 256-bit | 8GB GDDR6 14Gbps 256-bit | 11GB GDDR6X 19.5Gbps 384-bit | 11GB GDDR6 14Gbps 320-bit | Memory is 2x larger but speed gets minor bump. | |
| Memory Bandwidth (GB/s) |
512GB/s [+14%] | 448GB/s | 936GB/s | 616GB/s | Bandwidth is 9% just higher. | |
| L1 Caches (kB) |
32kB / WG + 128kB/Array | 64kB/Array | 82x 128kB/SM | 68x 96kB/SM | L1 has been doubled (2x) | |
| L2 Cache (MB) |
4MB | 4MB | 6MB | 5.5MB | L2 has not changed. | |
| Maximum Work-group Size |
1024 / 1024 | 1024 / 1024 | 1024 / 2048 per SM | 1024 / 2048 per SM | AMD has unlocked work-group sizes to 4x. | |
| FP64/double ratio |
1/16x | 1/16x | 1/32x | 1/32x | Ratio is 2x nVidia. | |
| FP16/half ratio |
2x | 2x | 2x | 2x | Ratios are the same throughput. | |
| Price (USD) |
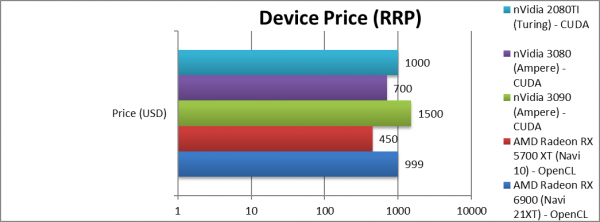
999 [+2x] | 450 | 1,500 | 1,000 | Price is 2x Navi1! | |
AMD Radeon 6900 XT
Disclaimer
This is an independent article that has not been endorsed nor sponsored by any entity (e.g. AMD). All trademarks acknowledged and used for identification only under fair use.
The article contains only public information (available elsewhere on the Internet) and not provided under NDA nor embargoed. At publication time, the products have not been directly tested by SiSoftware and thus the accuracy of the benchmark scores cannot be verified; however, they appear consistent and do not appear to be false/fake.
Processing Performance
We are testing both OpenCL performance using the latest SDK / libraries / drivers from both AMD and competition.
Results Interpretation: Higher values (GOPS, MB/s, etc.) mean better performance.
Environment: Windows 10 x64, latest AMD and nVidia drivers. Turbo / Boost was enabled on all configurations.
| Processing Benchmarks | AMD Radeon 6900XT (Navi2X) | AMD Radeon 5700XT (Navi1) | nVidia 3090 (Ampere) | nVidia 2080TI (Turing) | Comments | |
 |
||||||
 |
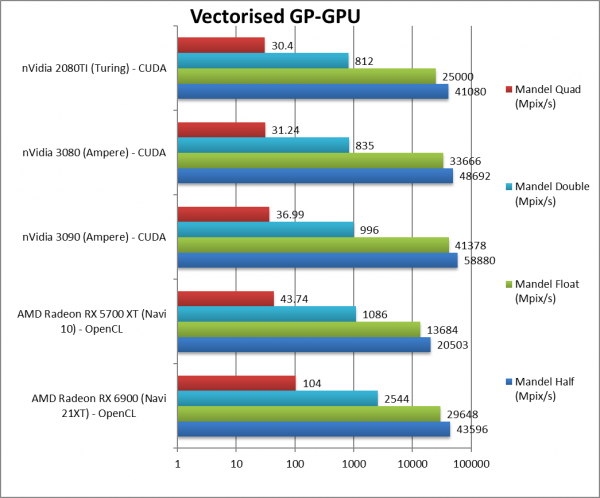
Mandel FP16/Half (Mpix/s) | 43,596 [+2.13x] | 20,503 | 58,880 | 41,080 | Navi2 is over 2x faster than Navi1 but not enough to beat Ampere. |
|
Mandel FP32/Single (Mpix/s) | 29,648 [+2.17x] | 13,684 | 41,378 | 25,000 | Standard FP32 is again over 2x but just beating Turing. |
|
Mandel FP64/Double (Mpix/s) | 2,544 [+2.34x] | 1,086 | 996 | 812 | FP64 is over 2.3x faster and beating all nVidia cards by over 2x also. |
|
Mandel FP128/Quad (Mpix/s) | 104 [+2.38x] | 43.74 | 36.99 | 30.4 | Emulated FP128 is hard on FP64 units but again Navi2 is almost 2.4x faster! |
| Navi2 start is impressive – it is over 2x (2.1-2.4x) faster than Navi2 across all precisions FP16/FP32 and FP64. Unfortunately, it is not enough to beat nVidia’s latest Ampere but at least it beats previous-gen Turing.
However, due to lower FP32/64 ratio (1/16x), it dominates FP64 performance – over 2x Ampere; so if your workload needs high precision – then Navi2 should be your choice. Will nVidia “ungimp” FP64 performance on consumer cards? |
||||||
 |
||||||
 |
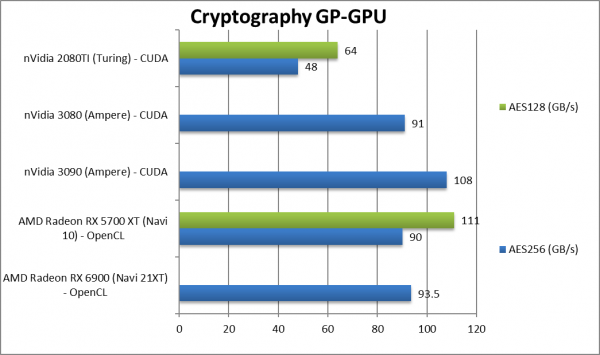
Crypto AES-256 (GB/s) | 93.5 [+4%] | 90 | 108 | 48 | Navi2 is just 4% faster being memory bandwidth constrained. |
|
Crypto AES-128 (GB/s) | 111 | 64 | – | ||
 |
||||||
|
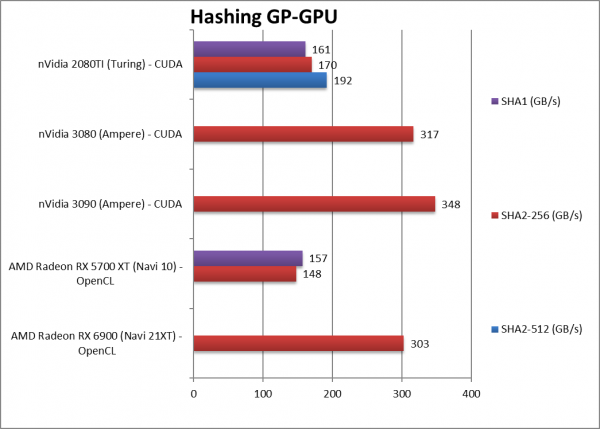
Crypto SHA2-256 (GB/s) | 303 [+2.05x] | 148 | 348 | 192 | Navi2 is over 2x faster in this compute heavy algorithm. |
|
Crypto SHA1 (GB/s) | 157 | 170 | – | ||
|
Crypto SHA2-512 (GB/s) | 161 | – | |||
| Streaming (bandwidth dependent) algorithms (en/decryption) don’t run much faster on Navi2 as memory bandwidth is just 14% higher over Navi1. We really need HBM2 back (e.g. Vega) for Navi2 to fly.
However, compute heavier algorithms (hashing) with reduced memory bandwidth demands – do allow Navi2 to be 2x faster than Navi1 – though not enough to beat Ampere. |
||||||
 |
||||||
 |
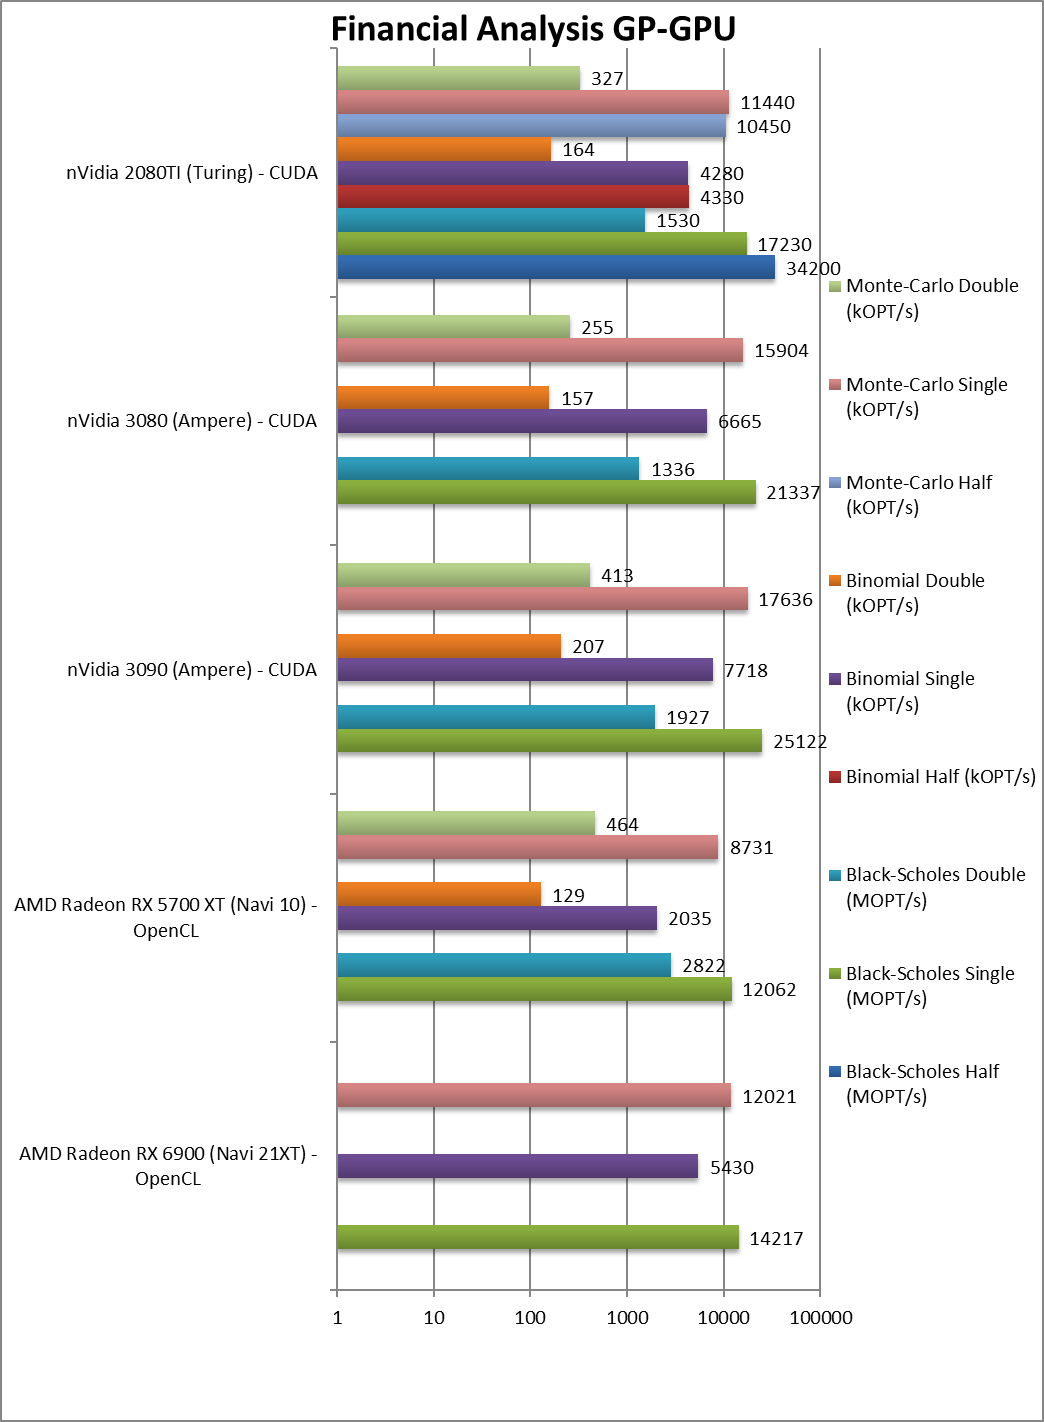
Black-Scholes float/FP32 (MOPT/s) | 14,217 [+18%] | 12,062 | 25,122 | 17,230 | In this FP32 financial workload Navi2 is 18% faster than Navi1. |
|
Black-Scholes double/FP64 (MOPT/s) | 2,822 | 1,927 | 1,530 | – | |
|
Binomial float/FP32 (kOPT/s) | 5,430 [+2.67x] | 2,035 | 7,718 | 4,280 | Binomial uses thread shared data thus stresses the memory system – Navi2 is over 2.5x faster than Navi1. |
|
Binomial double/FP64 (kOPT/s) | 129 | 207 | 164 | – | |
|
Monte-Carlo float/FP32 (kOPT/s) | 12,021 [+38%] | 8,731 | 17,636 | 11,440 | Monte-Carlo also uses thread shared data but read-only thus reducing modify pressure: Navi2 is 40% faster. |
|
Monte-Carlo double/FP64 (kOPT/s) | 464 | 413 | 327 | – | |
| For financial FP32 workloads, Navi2 is between 20%-2.6x faster than Navi1 – a decent improvement, again likely held back by memory bandwidth. Here the old Vega with HBM2 would dominate all algorithms. Again, it is not able to beat nVidia’s Ampere but trades blows with Turing. | ||||||
 |
||||||
 |
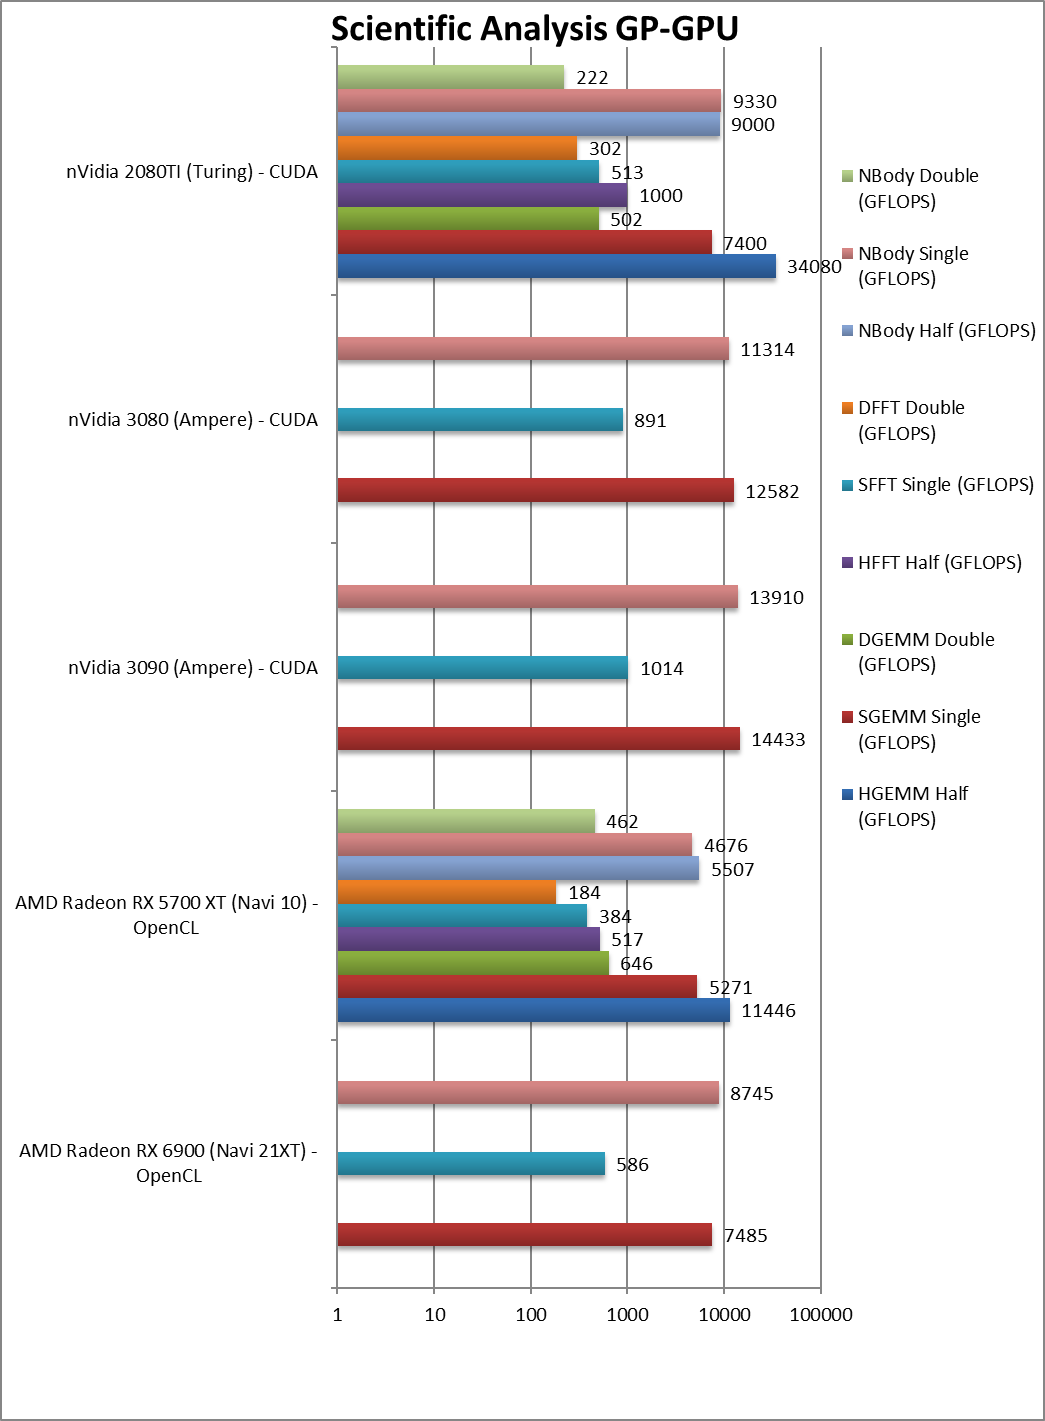
SGEMM (GFLOPS) float/FP32 | 7,485 [+42%] | 5,271 | 14,433 | 7,400 | GEMM brings 42% improvement over Navi1. |
|
DGEMM (GFLOPS) double/FP64 | 646 | 502 | – | ||
|
SFFT (GFLOPS) float/FP32 | 586 [+53%] | 384 | 1,014 | 513 | FFT also improved by a decent 53% on Navi2. |
|
DFFT (GFLOPS) double/FP64 | 184 | 302 | – | ||
|
SNBODY (GFLOPS) float/FP32 | 8,745 [+87%] | 4,676 | 13,910 | 9,330 | Navi2 improves by a whopping 87% over Navi1 in N-Body. |
|
DNBODY (GFLOPS) double/FP64 | 462 | 222 | – | ||
| The scientific FP16/32 algorithms scale better, with Navi2 between 42-87% improvement over Navi1 – again likely held back by memory bandwidth. Unfortunately, Ampere is generally 2x faster than it – but it is enough to trade blows with Turing, something Navi1 could not hope to do.
Thankfully due to the high FP32/64 ratio on nVidia consumer cards – Navi2 is still a great choice for high-precision (FP64) workloads. |
||||||
 |
||||||
 |
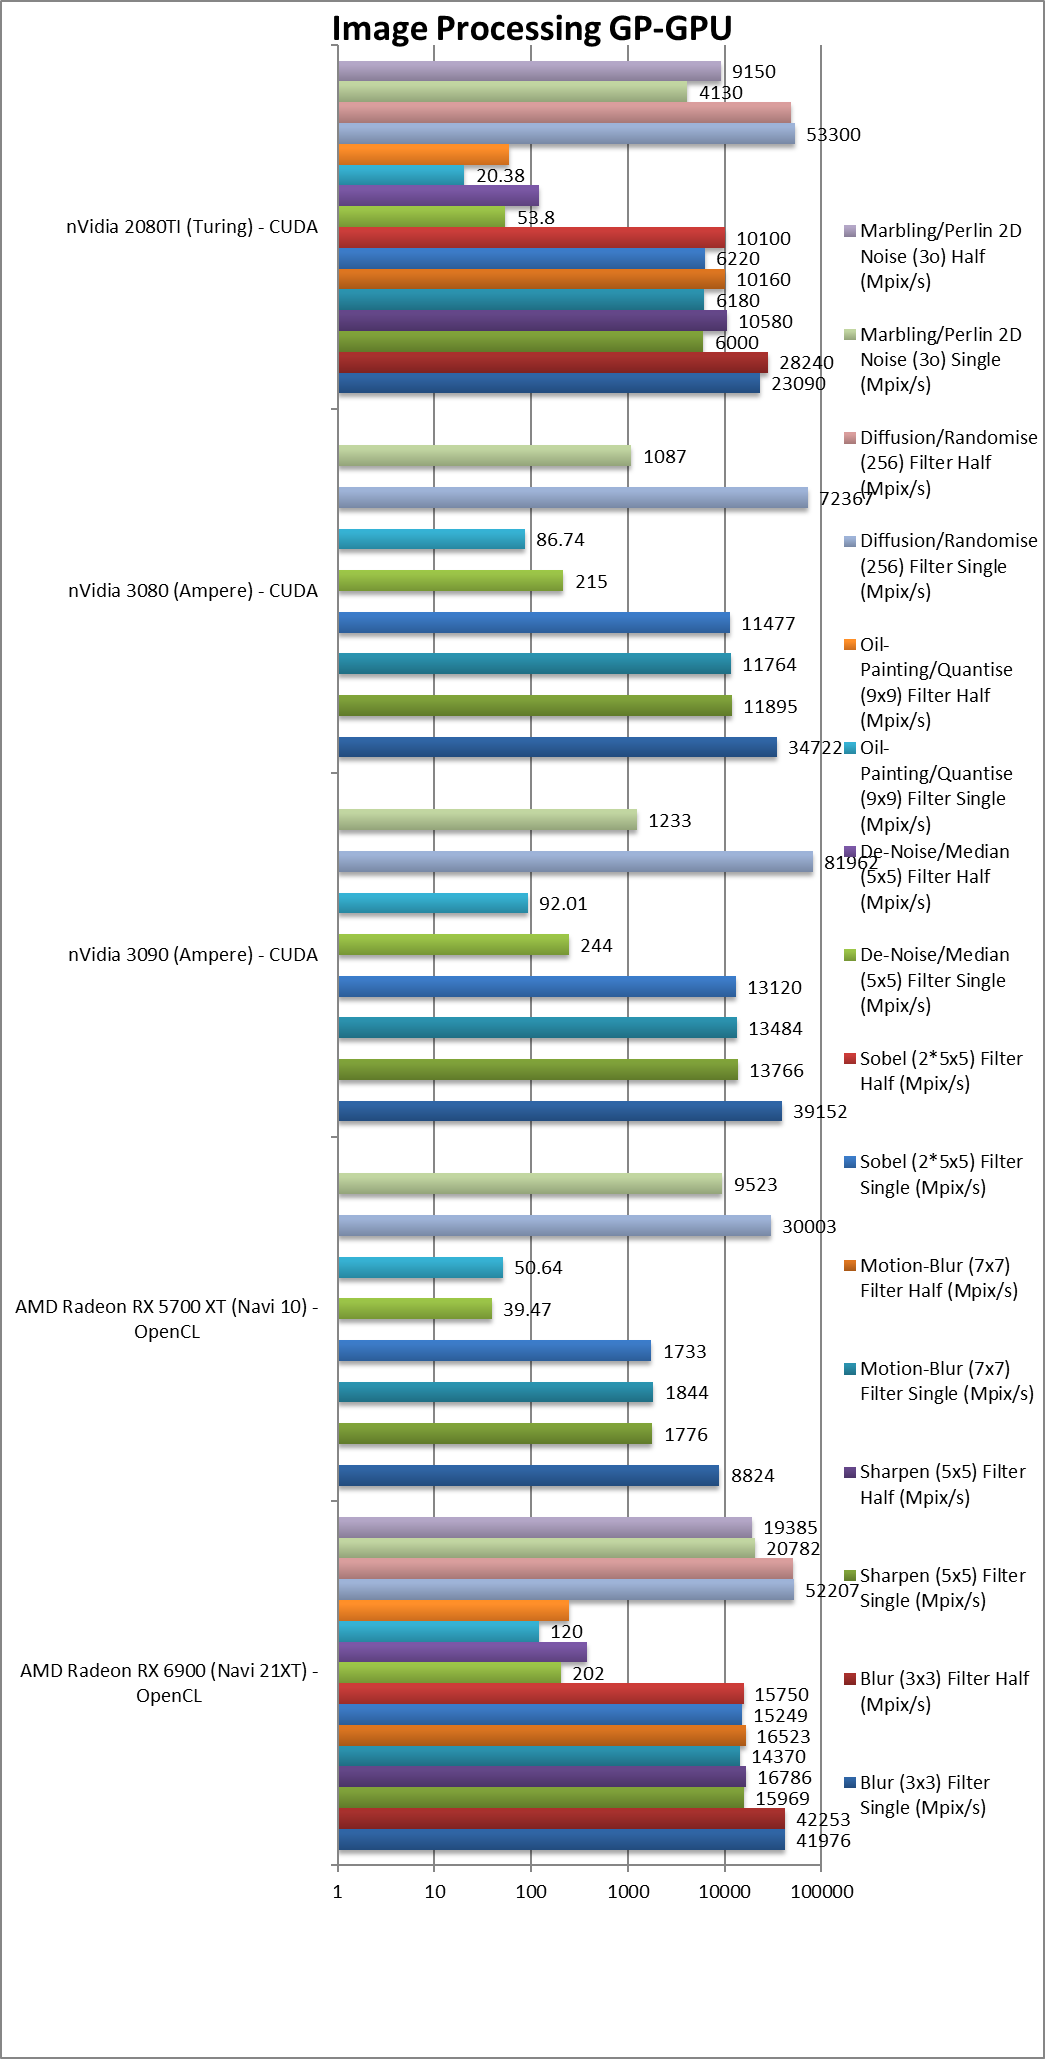
Blur (3×3) Filter single/FP32 (MPix/s) | 41,976 [+4.76x] | 8,824 | 39,152 | 23,090 | In this 3×3 convolution algorithm, Navi2 is almost 5x faster! |
|
Sharpen (5×5) Filter single/FP32 (MPix/s) | 15,969 [+9x] | 1,776 | 13,766 | 6,000 | Same algorithm but more shared data makes Navi2 almost 9x faster!! |
|
Motion Blur (7×7) Filter single/FP32 (MPix/s) | 14,370 [+7.8x] | 1,844 | 13,484 | 6,180 | With even more data the gap remains at almost 8x. |
|
Edge Detection (2*5×5) Sobel Filter single/FP32 (MPix/s) | 15,249 [+8.8x] | 1,733 | 13,120 | 6,220 | Still convolution but with 2 filters – similarly almost 9x faster!! |
|
Noise Removal (5×5) Median Filter single/FP32 (MPix/s) | 202 [+5.1x] | 39,47 | 244 | 53.8 | Different algorithm makes Navi2 “only” 5x faster. |
|
Oil Painting Quantise Filter single/FP32 (MPix/s) | 120 [2.4x] | 50.64 | 92.01 | 20.38 | Without major processing, this filter performs well on Navi. |
|
Diffusion Randomise (XorShift) Filter single/FP32 (MPix/s) | 52,207 [+74%] | 30,003 | 81,962 | 53,300 | This algorithm is 64-bit integer heavy and Navi2 is 74% faster. |
|
Marbling Perlin Noise 2D Filter single/FP32 (MPix/s) | 20,782 [+2.2x] | 9,523 | 10,233 | 4,130 | One of the most complex and largest filters, Navi2 is over 2x faster |
| For image processing using FP32 precision, Navi2 is at least 2x if not 7-9x faster than Navi1!! We can only assume something major was fixed either in driver/hardware as Navi1 performance has always been abnormally low. Now, Navi2 can match and even beat (though by a small margin) nVidia’s finest Ampere – a huge result.
FP16 performance is not as impressive, showing that we, again hit likely a memory limit that additional compute power cannot help. |
||||||
 |
||||||
|
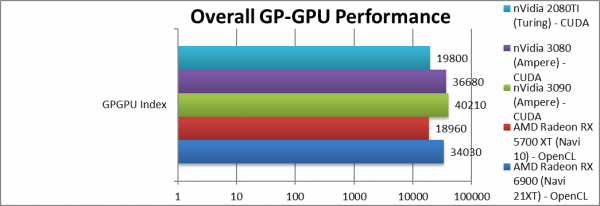
Overall GP-GPU Performance (Points) | 34,030 [+80%] | 18,960 | 40,210 | 19,800 | Overall (including memory) Navi2 is 80% faster than Navi1. |
| While in compute heavy tasks Navi2 is at least 2x faster than Navi1, the streaming benchmarks and memory benchmarks/latency drag the score down to just 80% faster than Navi1. We will need much faster GDDR6X or HBM2 memory to ensure closer to 2x performance overall. | ||||||
 |
||||||
 |
Power/TDP (W) | 300 [+33%] | 225 | 350 | 260 | Power has increased by a modest 33%. |
 |
||||||
|
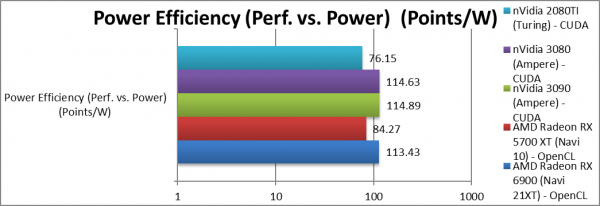
Performance/Power (Power Efficiency) (Points/W) | 113 [+35%] | 84 | 114 | 76 | Navi2 power efficiency is 35% better than Navi1. |
| With only 33% in TDP/Power, the ~80% performance increase over Navi1 makes Navi2 35% more efficient – a great result. Despite a huge power increase, the sheer power of nVidia’s Ampere makes it just as power efficient! Strangely both are absolutely tied here! | ||||||
 |
||||||
 |
Price/RRP (USD) | $999 [+2x] | $450 | $1,500 | $1,000 | Price has doubled vs. Navi1. |
 |
||||||
|
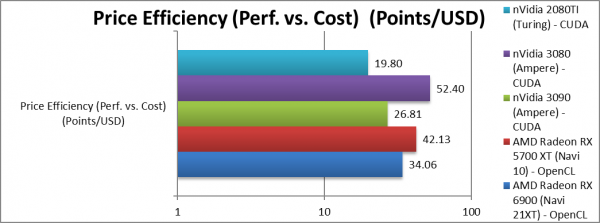
Performance/Power (Power Efficiency) (Points/W) | 34.06 [-20%] | 42.13 | 26.80 | 19.8 | Navi2 price efficiency is 20% lower than Navi1. |
| While Navi2 is about 80% faster than Navi1 across all algorithms, the price has doubled – makeing it 20% less “bang-for-buck”. However, in most compute algorithms (not memory bound) – the performance is closer to 2x (twice) – thus the value should be about the same. | ||||||
Memory Performance
We are testing both OpenCL performance using the latest SDK / libraries / drivers from AMD and competition.
Results Interpretation: For bandwidth tests (MB/s, etc.) high values mean better performance, for latency tests (ns, etc.) low values mean better performance.
Environment: Windows 10 x64, latest AMD and nVidia. drivers. Turbo / Boost was enabled on all configurations.
| Memory Benchmarks | AMD Radeon 6900XT (Navi2X) | AMD Radeon 5700XT (Navi1) | nVidia 3090 (Ampere) | nVidia 2080TI (Turing) | Comments | |
 |
||||||
 |
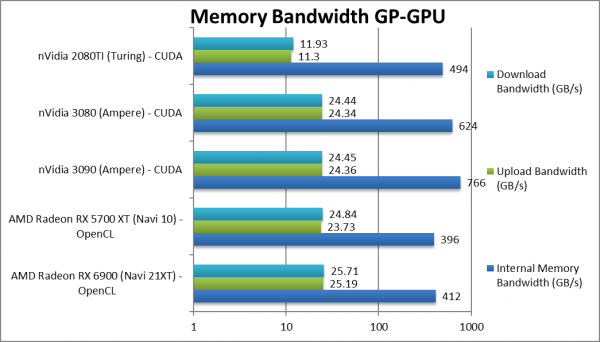
Internal Memory Bandwidth (GB/s) | 412 [+4%] | 396 | 766 | 494 | Navi2 gets a meager 4% bandwidth bump. |
|
Upload Bandwidth (GB/s) | 25.19 [+6%] | 23.73 | 24.36 | 11.3 | All modern cards have PCIe4 bus now. |
|
Download Bandwidth (GB/s) | 25.71 [+4%] | 24.84 | 24.45 | 11.93 | Again just 4% change. |
| Navi2’s 14% on-paper bandwidth upgrade translates to just 4% in real life and is perhaps the reason it does not beat Navi1 in all algorithms. AMD should really use faster memory/GDDR6X to feed all the extra cores and will likely use HBM2 on professional cards.
Navi1 already has a PCIe4 interface (on 500-series AMD and soon 500-series Intel) thus minor improvement in upload/download bandwidth that only shines compared to much older PCIe3 cards (e.g. nVidia’s Turing). |
||||||
 |
||||||
 |
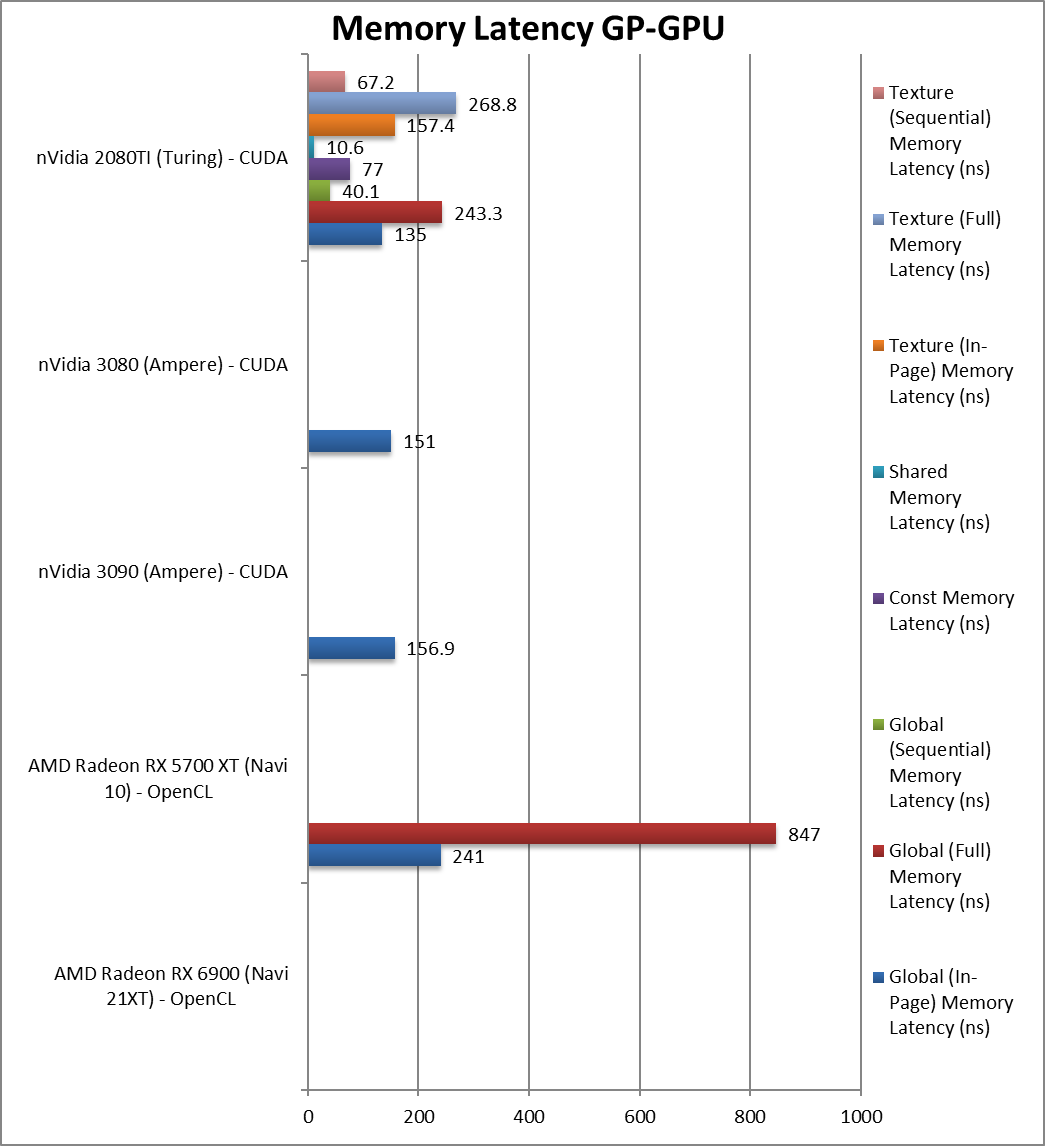
Global (In-Page Random Access) Latency (ns) | 207 [-14%] | 241 | 156 | 135 | Due to the higher speed latency is 14% lower. |
|
Global (Full Range Random Access) Latency (ns) | 847 | 243 | – | ||
|
Global (Sequential Access) Latency (ns) | 40 | – | |||
|
Constant Memory (In-Page Random Access) Latency (ns) | 77 | – | |||
|
Shared Memory (In-Page Random Access) Latency (ns) | 10.6 | – | |||
|
Texture (In-Page Random Access) Latency (ns) | 157 | – | |||
|
Texture (Full Range Random Access) Latency (ns) | 268 | – | |||
|
Texture (Sequential Access) Latency (ns) | 67 | – | |||
| Not unexpected, GDDR6′ latencies are higher than HBM2 although not by as much as we were fearing. | ||||||
SiSoftware Official Ranker Scores
Final Thoughts / Conclusions
Sumary: Decent in compute but not top except for FP64: 8/10 Recommended
Ever since the release of Navi1 (“little-Navi”) and its revolutionary new architecture AMD fans everywhere have eagerly awaited the release of “big-Navi” that can bring the fight to nVidia. A year or so later – we have Navi2: pretty much twice Navi1 + ray-tracing – tensors/tiles. It is everything that was expected but in some ways perhaps we expected more?
Compute (FP16/FP32) performance generally matches expectations – it is usually over twice (2x+) as fast as Navi1 in most algorithms, though in some cases even 9x faster in image processing – showing its “gamer” credentials. Unfortunately, this is insufficient to beat nVidia’s latest “Ampere” top-end cards that are usually 2x faster still – but at least it does trade blows with previous “Turing” generation.
Compute FP64 performance is much better thanks to lower FP32/64 ratio (1/16x vs. nVidia 1/32x) that allows it to beat nVidia’s cards generally by 2x – thus if you use high-precision algorithms – Navi2 can be the better choice.
Memory-wise, it seems the meager bandwidth improvement over Navi1 is holding Navi2 back – with old Vega’s HBM2 memory sorely missed. However, it is likely AMD will use that in its professional cards to battle nVidia’s Titan cards (that also used to have HBM2 e.g. “Volta”). At least now we have twice (16GB) of memory which can hold much bigger kernels – and is larger than nVidia’s 3080 (12GB) but naturally not as large as the top end 3090 (24GB).
The price (USD 1,000) is also twice the old Navi1 price thus you are getting slightly better performance for your money (as it is generally over 2x faster). TDP/Power has gone up by 33% (300W) but efficiency is naturally much better than Navi1 and should not require a new power supply.
In summary – for compute Navi2 is not the same outright success that it is for gamers; it cannot match or beat current competition but does perform well and perhaps with maturing drivers even better. At last you get a great gamer card which you can use for compute (crypto-mining?) during “free time”.
To see how the “little-brother” Navi2L performs see our AMD Radeon RX 6800 (RDNA2, Navi2L) Review & Benchmarks – GPGPU Performance article.
AMD Radeon 6900 XT
Disclaimer
This is an independent article that has not been endorsed nor sponsored by any entity (e.g. AMD). All trademarks acknowledged and used for identification only under fair use.
The article contains only public information (available elsewhere on the Internet) and not provided under NDA nor embargoed. At publication time, the products have not been directly tested by SiSoftware and thus the accuracy of the benchmark scores cannot be verified; however, they appear consistent and do not appear to be false/fake.