What is “Hyper-V”?
Hyper-V is Microsoft’s virtualisation solution, a Type 1 (i.e. “bare-metal”) hypervisor that is included in both Windows Server (2005) and more recently Windows Client (e.g. Windows 10). A hypervisor creates “virtual computers” where complete operating systems (VMs) can be installed – all sharing the same physical hardware.
While companies have been virtualising servers for a decade, not to forget more recent transition to the “cloud” – client computers generally used Type 2 (i.e. running on top of operating system) hypervisors (e.g. Oracle VirtualBox, VmWare Workstation, Microsoft’s old Virtual PC). With new security technologies like “Core Isolation“, “Windows Memory Integrity“, container technologies (e.g. Docker) and programming environments (e.g. Android, Windows Mobile (now dead)) many users now have Hyper-V enabled.
Hyper-V like most modern hypervisors do require hardware-assistance virtualisation support (e.g. Intel VT-x, AMD-V), SLAT (2nd Level Address Translation) and IOMMU (e.g. Intel VT-d) but most modern hardware (CPU, chipset, BIOS, etc.) should support these.
One huge advantage of Hyper-V is that unlike dedicated hypervisors (e.g. VmWare ESXi) it uses standard Windows drivers for hardware – thus if Windows supports it, Hyper-V will support it too – which can be important when the hardware is not “server grade”, niche or too old or too new.
What is the (performance) impact of enabling Hyper-V?
Enabling Hyper-V is easy and visual changes are minimal – but big changes take place “under the hood”; the operating system (Windows) no longer runs on the bare-metal but becomes a VM (virtual machine) running as the “root/parent partition” to which key hardware is passed-through. Hardware like the video card (GP-GPU) thus work as if nothing has happened but can be “detached” and “passed-trough” to other VMs (child partitions) that can now be run in addition to the root operating system. However, only one (1) VM can use the hardware directly.
More advanced hardware (generally network cards) support SR-IOV (Single-Root I/O Virtualisation) that can expose multiple VFs (Virtual Functions) that allow it to be shared between VMs as if they all have their own hardware. New video cards (e.g. nVidia “Ampere”) now support SR-IOV allowing multiple VMs to use hardware compute (GPGPU) capabilities of the physical host.
While this root partition Windows now inhabits is “priviledged” having access to all the hardware – it is still virtualised running on top of Hyper-V and thus performance will be impacted. Mitigations for vulnerabilities (e.g. “Meltdown”, “Spectre”, “MDS”, etc.) may apply to both hypervisor in addition to the root Windows operating system and would impact performance even further.
Users may decide to create and run other VMs (child partitions), install additional copies of Windows and run various applications or services there – and leave the host Windows partiton “clean”. A better way would be to use the free Windows Hyper-V Server to manage Hyper-V and create and run Windows client as a VM.
Why measure the performance impact of hypervisors?
Power users (i.e. our clients using Sandra) want to get the very best performance out of their systems; many may overclock or even disable vulnerabilities mitigations in the quest for the highest performance (or benchmark scores). While modern hardware and hypervisors use virtualisation-acceleration features – there is still a performance impact to enabling virtualisation (and thus Hyper-V). Even on modern hardware with many cores & threads – this performance degradation may be significant.
Users may also need to create a VM/container using an older (e.g. Windows 7, XP, etc.) or different (e.g. Linux, FreeBSD, etc.) operating system in order to run older/non-Windows applications or services (e.g. game emulation, firewall/VPN, home automation, etc.) that cannot run on the host operating system.
It is also a good idea to run untrusted apps/services in a separate VM/container in order not to corrupt the host operating system. Evaluation software (whether try-before-you-buy or pre-release/beta) are also commonly provided in container/VM form for easy deployment and evaluation.
CPU Performance Impact of Hyper-V
In this article we test CPU core performance; please see our other articles on:
- Performance Impact of Hyper-V virtualisation (Windows 10 Pro) – Cache and Memory
- Performance Impact of Hyper-V virtualisation (Windows 10 Pro) – Storage
- Performance Impact of Hyper-V virtualisation (Windows 10 Pro) – Networking
Hardware Specifications
We are comparing (relatively) high-end desktop hardware running latest (client) Windows with/without Hyper-V and running a Windows (client) VM of comparable specification.
| CPU Specifications | Bare-Metal (Intel i9-7900X) 10C/20T | Root HyperV (Intel i9-7900X) 10C/20T | VM HyperV (Intel i9-7900X) 20 vCpu | Comments | |
| Cores (CU) / Threads (SP) | 10C / 20T | 10C / 20T | 20 vCPUs | Same thread counts. | |
| Memory | 4x 8GB (32GB) DDR4 3200Mt/s | 4x 8GB (32GB) DDR4 3200Mt/s | 24GB | VM has slightly less memory assigned. | |
| Power Profile |
Balanced | Balanced | Balanced | Default power profile. | |
| Storage | 512GB NVMe NTFS | 512GB NVMe NTFS | 256GB NTFS VMDX | Same storage backend | |
| Instruction Sets | AVX512, AES | AVX512, AES | AVX512, AES | All instruction sets passed through (native) | |
Native Performance
We are testing native arithmetic, SIMD and cryptography performance using the highest performing instruction sets (AVX512*, AES*, SHA*).
Note(*): To enable advanced SIMD instruction sets in a VM – the VM must have “Migrate to a physical processor with different processor version” disabled; otherwise only basic instruction sets will be available resulting in much lower performance.
Results Interpretation: Higher values (GOPS, MB/s, etc.) mean better performance.
Environment: Windows 10 x64, latest Intel drivers. 2MB “large pages” were enabled and in use. Turbo / Boost was enabled on all configurations.
| Native Benchmarks | VM HyperV (Intel i9-7900X) 20 vCpu | Root HyperV (Intel i9-7900X) 10C/20T | Bare-Metal (Intel i9-7900X) 10C/20T | Comments | ||
 |
||||||
 |
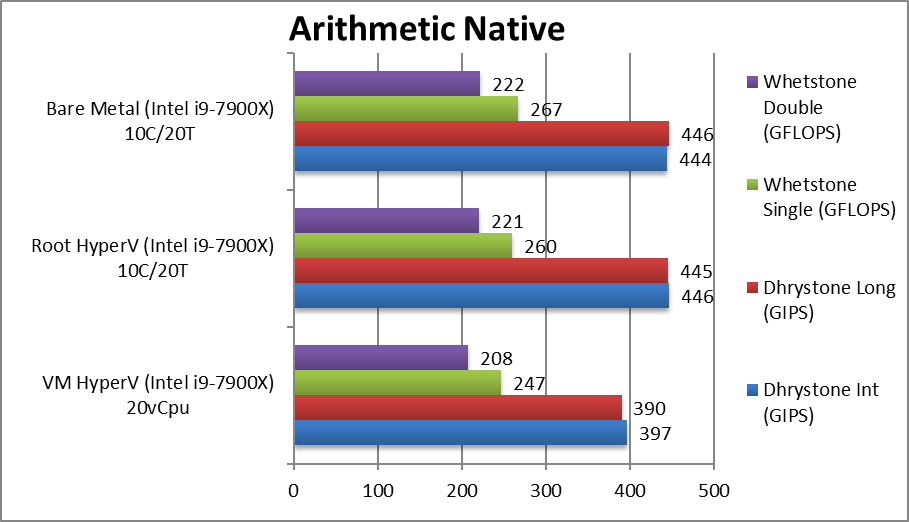
Native Dhrystone Integer (GIPS) | 397 [-11%] | 446 [=] | 444 | No difference for Root, VM is 11% slower. | |
|
Native Dhrystone Long (GIPS) | 390 [-13%] | 445 [=] | 446 | No significant changes, VM is 13% slower. | |
|
Native FP32 (Float) Whetstone (GFLOPS) | 247 [-7%] | 260 [-3%] | 267 | With floating-point, VM is 7% slower and root 3% slower. | |
|
Native FP64 (Double) Whetstone (GFLOPS) | 208 [-6%] | 221 [=] | 222 | With FP64, VM is just 6% slower. | |
| With legacy workloads (not using SIMD) – the root partition is just as fast as bare metal. The VM, despite the same number of threads does take a performance hit between 6 and 13% – higher for integer workloads, lower for floating-point. | ||||||
 |
||||||
 |
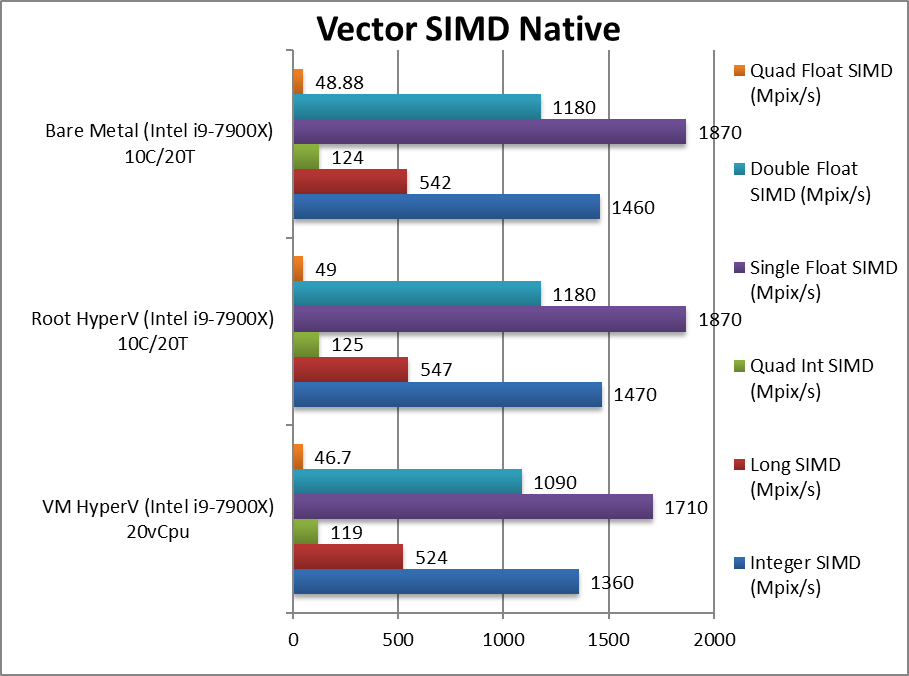
Native Integer (Int32) Multi-Media (Mpix/s) | 1,360 [-7%] | 1,470 [=] | 1,460 | With AVX512, VM is 7% slower, Root no change. | |
|
Native Long (Int64) Multi-Media (Mpix/s) | 524 [-3%] | 547 [+1%] | 542 | With a 64-bit AVX512 integer no change. | |
|
Native Quad-Int (Int128) Multi-Media (Mpix/s) | 119 [-4%] | 125 [+1%] | 124 | A tough test using long integers to emulate Int128 no change. | |
|
Native Float/FP32 Multi-Media (Mpix/s) | 1,710 [-9%] | 1,870 [=] | 1,870 | In this floating-point vectorised test VM is 9% slower. | |
|
Native Double/FP64 Multi-Media (Mpix/s) | 1,090 [-8%] | 1,180 [=] | 1,180 | Switching to FP64 SIMD AVX512 code no change. | |
|
Native Quad-Float/FP128 Multi-Media (Mpix/s) | 46.7 [-5%] | 49 [=] | 48.88 | A heavy algorithm using FP64 to mantissa extend FP128 no change. | |
| With heavily vectorised SIMD workloads – we still see a similar pattern. Root partition is as fast as bare metal, but VM does take a less performance hit between 3-9%. Thus, enabling HV has no discernible effect on heavy compute performance (on root partition with no VMs running) – while even VM use has only a small performance impact. | ||||||
 |
||||||
 |
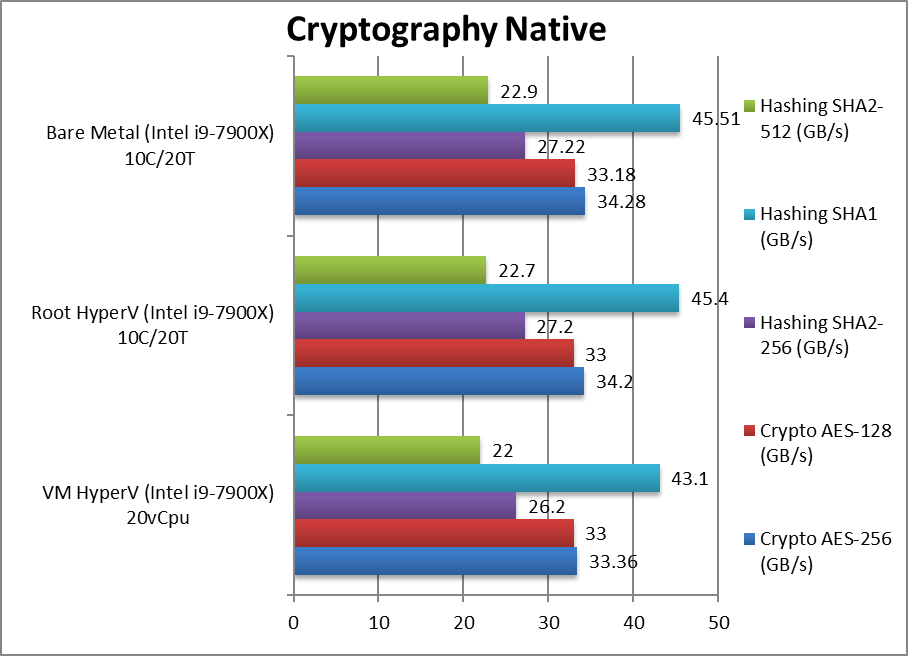
Crypto AES-256 (GB/s) | 33.36 [-3%] | 34.2 [=] | 34.28 | Memory bandwidth rules here thus VM is just 3% slower. | |
|
Crypto AES-128 (GB/s) | 33 [=] | 33 [=] | 33.18 | No performance difference here at all. | |
|
Crypto SHA2-256 (GB/s) | 26.2 [-4%] | 27.2 [=] | 27.2 | VM is 4% slower here. | |
|
Crypto SHA1 (GB/s) | 43.1 [-5%] | 45.4 [=] | 45.5 | Less compute intensive SHA1 makes VM 5% slower. | |
|
Crypto SHA2-512 (GB/s) | 22 | 22.7 [-4%] | 22.9 | SHA2-512 is compute intensive thus same performance. | |
| The memory sub-system bandwidth is crucial here, and we see the least variation in performance – even the VM ties up with bare metal in two tests. For streaming tests, HV does not affect performance – we shall later see if this holds for latency tests. | ||||||
 |
||||||
 |
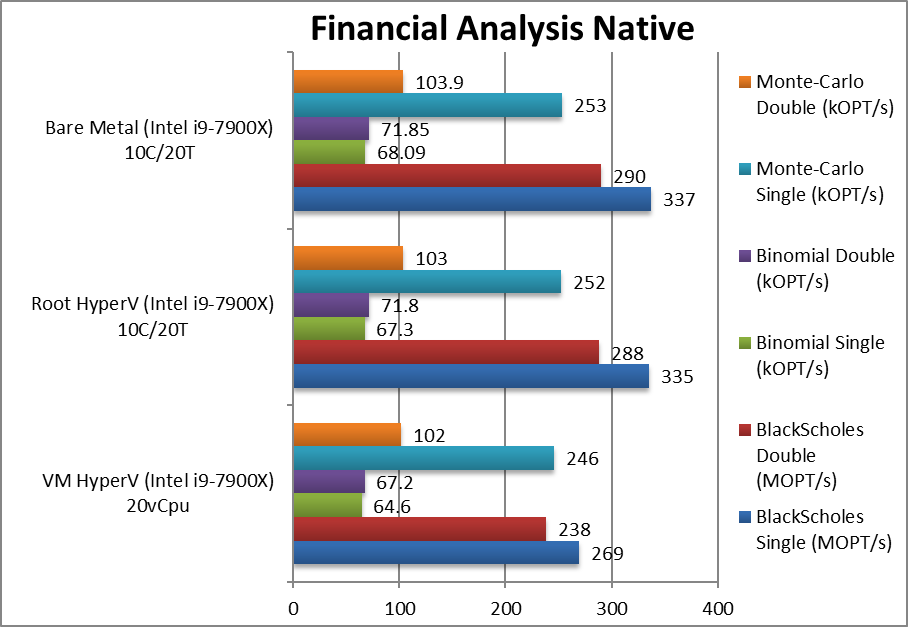
Black-Scholes float/FP32 (MOPT/s) | 269 [-20%] | 335 [-1%] | 337 | With BS we see the biggest VM hit of 20%. | |
|
Black-Scholes double/FP64 (MOPT/s) | 238 [-18%] | 288 [-1%] | 290 | Using FP64 we see a similar 18% loss. | |
|
Binomial float/FP32 (kOPT/s) | 64.6 [-5%] | 67.3 [-1%] | 68.1 | Binomial uses thread shared data and here we see a 5% loss. | |
|
Binomial double/FP64 (kOPT/s) | 67.2 [-6%] | 71.8 [=] | 71.85 | With FP64 code we see a 6% loss. | |
|
Monte-Carlo float/FP32 (kOPT/s) | 246 [-3%] | 252 [=] | 253 | Monte-Carlo also uses thread shared data but read-only thus reducing modify pressure on the caches. | |
|
Monte-Carlo double/FP64 (kOPT/s) | 102 [-2%] | 103 [-1%] | 103.9 | Switching to FP64 we see only a 2% loss. | |
| With non-SIMD financial workloads, we see the biggest performance drop for VM of ~20%, though other tests are just 2-6% slower. Root partition use is just 1% slower than bare metal which is within margin of error. Still, it is more likely that the GPGPU will be used for such workloads today. | ||||||
 |
||||||
 |
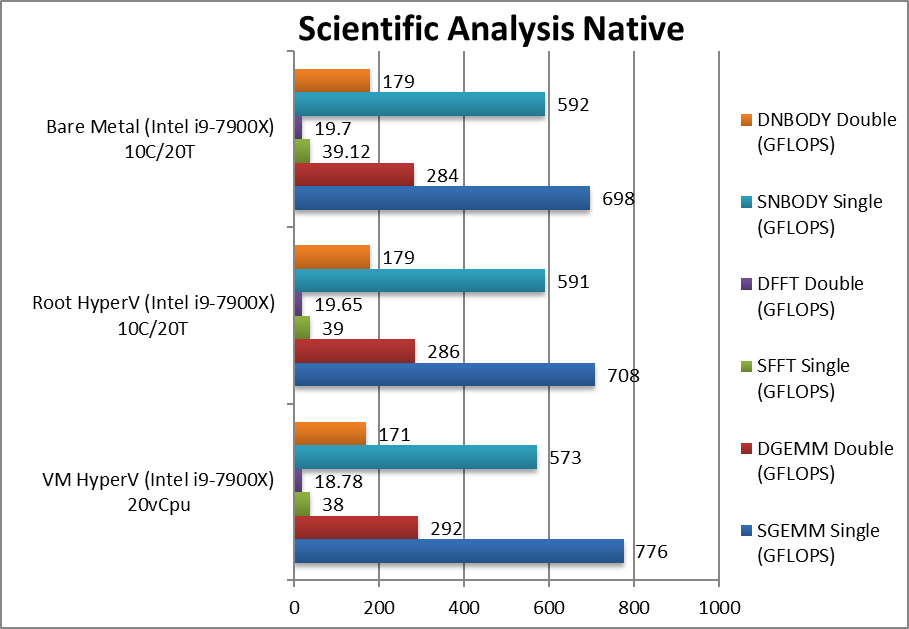
SGEMM (GFLOPS) float/FP32 | 706 [+1%] | 708 [+2%] | 698 | In this tough vectorised algorithm, we see minor changes. | |
|
DGEMM (GFLOPS) double/FP64 | 292 [+2%] | 286 [+1%] | 284 | With FP64 vectorised code, minor change. | |
|
SFFT (GFLOPS) float/FP32 | 38 [-3%] | 39 [=] | 39.12 | FFT is also heavily vectorised but memory dependent still minor. | |
|
DFFT (GFLOPS) double/FP64 | 18.78 [-5%] | 19.65 [=] | 19.7 | With FP64 code, nothing much changes. | |
|
SNBODY (GFLOPS) float/FP32 | 573 [-4%] | 591 [=] | 592 | N-Body simulation is vectorised but with more memory accesses. | |
|
DNBODY (GFLOPS) double/FP64 | 171 [-4%] | 179 [=] | 179 | With FP64 code we see 4% loss. | |
| With highly vectorised SIMD code (scientific workloads), the performance changes become minimal – with even VM at most 4% slower and in some cases even slightly faster (likely due to synchronisation). For such heavy compute, you can even use VMs with no appreciable performance loss; naturally root partition shows no loss whatsoever. | ||||||
 |
||||||
 |
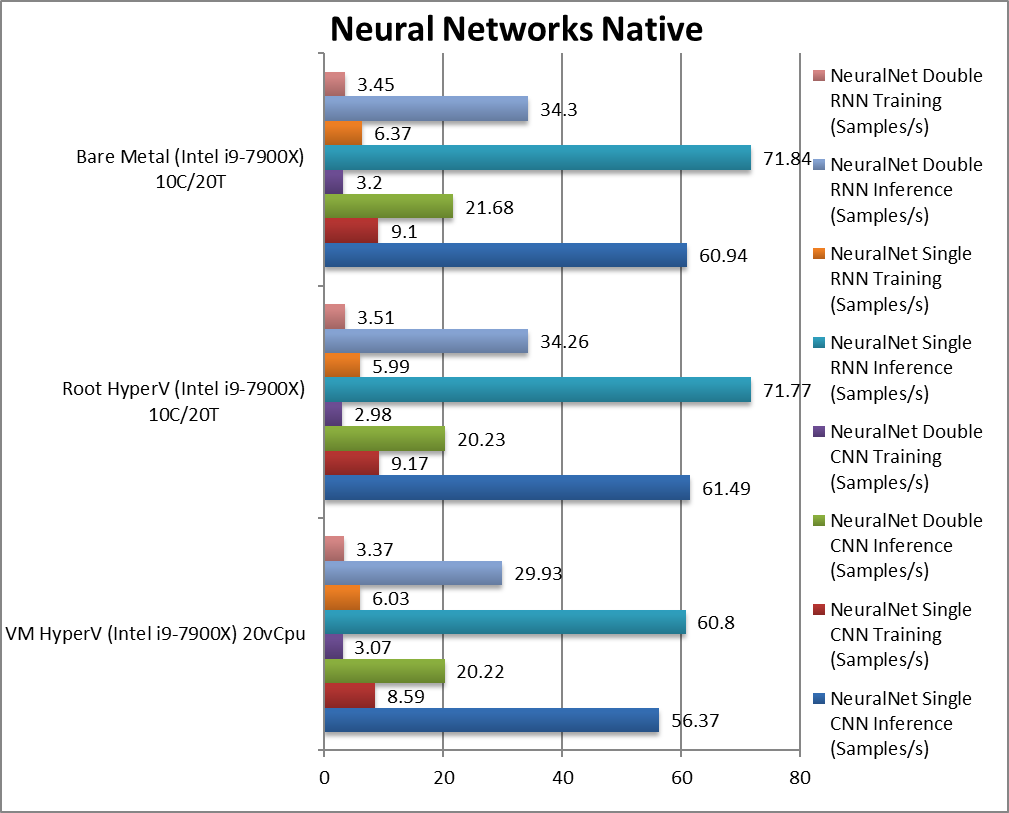
NeuralNet Single SCNN Inference (Samples/s) | 56.37 [-7%] | 61.49 [+1%] | 60.94 | Also heavily vectorised, inference is 7% slower in VM. | |
|
NeuralNet Single SCNN Training (Samples/s) | 8.59 [-6%] | 9.17 [=] | 9.1 | Training is compute intensive but we see similar results. | |
|
NeuralNet Double DCNN Inference (Samples/s) | 20.22 [-7%] | 20.23 [-7%] | 21.68 | FP64 brings first loss for root at 7% (same as VM) | |
|
NeuralNet Double DCNN Training (Samples/s) | 3.07 [-5%] | 2.98 [-7%] | 3.2 | FP64 training shows a similar 7% loss. | |
 |
NeuralNet Single SRNN Inference (Samples/s) | 60.8 [-15%] | 71.77 [=] | 71.84 | RNN is memory access heavy and here VM takes 15% loss. | |
|
NeuralNet Single SRNN Training (Samples/s) | 6.03 [-6%] | 5.99 [-6%] | 6.37 | Training is compute intensive but VM is just 6% slower. | |
|
NeuralNet Double DRNN Inference (Samples/s) | 29.92 [-13%] | 34.26 [=] | 34.3 | FP64 also brings a VM loss of 13% here. | |
|
NeuralNet Double DRNN Training (Samples/s) | 3.37 [-3%] | 3.51 [+1%] | 3.45 | Traning brings down loses to just 3% for VM. | |
| While heavily vectorised/SIMD, neural networks are also memory intensive which for the first time shows a loss for root partition, likely to different memory access latencies. However this is a very isolated result, not seen in other tests (so far). VM use also shows the largest performance loss of up to 15% though usual loses are between 5-7%. | ||||||
 |
||||||
|
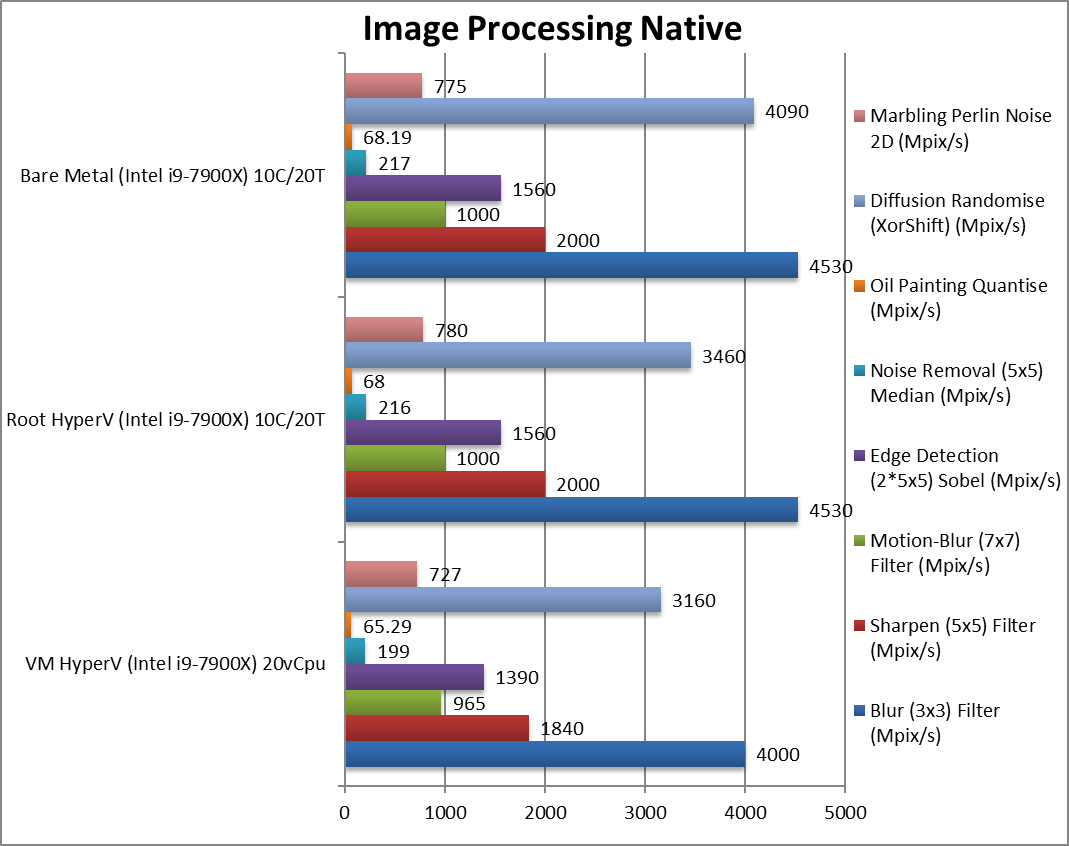
Blur (3×3) Filter (MPix/s) | 4,000 [-12%] | 4,530 [=] | 4,530 | In this vectorised integer workload VM is 12% slower. | |
|
Sharpen (5×5) Filter (MPix/s) | 1,840 [-8%] | 2,000 [=] | 2,000 | Same algorithm but more shared data VM is 8% slower. | |
|
Motion-Blur (7×7) Filter (MPix/s) | 965 [-5%] | 1,000 [=] | 1,000 | Again same algorithm but even more data shared VM is 5% slower. | |
|
Edge Detection (2*5×5) Sobel Filter (MPix/s) | 1,390 [-11%] | 1,560 [=] | 1,560 | Different algorithm but still vectorised VM is 11% slower. | |
|
Noise Removal (5×5) Median Filter (MPix/s) | 199 [-9%] | 216 [=] | 217 | Still vectorised VM is 9% slower. | |
|
Oil Painting Quantise Filter (MPix/s) | 65.29 [-4%] | 68 [=] | 68 | Different algorithm, VM is just 4% slower. | |
|
Diffusion Randomise (XorShift) Filter (MPix/s) | 3,160 [-23%] | 3,460 [-6%] | 4,090 | With integer workload, VM is 23% slower while Root is 6% slower. | |
|
Marbling Perlin Noise 2D Filter (MPix/s) | 727 [-7%] | 780 [=] | 775 | In this final test again VM is 7% slower. | |
| Similar to what we saw before, VM is between 4-12% slower than bare-metal with an outlier of 23% slower. Root partition is again as fast as bare metal – with an outlier of 6% slower. Overall we see the same deltas we have seen before. | ||||||
For native compute workloads, either legacy or vectorised/SIMD – enabling HV on the system has no discernible performance impact on the root partition (with *no* VMs running). Enabling HV for better security does not lose any performance.
Running the same workloads in a VM, even with the same number of threads (vCPU) as the system – does mean a performance loss between 5-10% depending on workload, with legacy (integer) workloads more affected (~10%) more than heavy SIMD compute workloads (~3-5%).
SiSoftware Official Ranker Scores
Final Thoughts / Conclusions
Virtualisation has come a long way and is no longer the preserve of servers; it is likely to be enabled by default even on client computers in order to provide security for the operating system (Windows) as well as providing isolation (sandboxes) for applications and services. You may even decide to run some additional VMs (e.g. running a different operating system like Linux, FreeBSD, etc.) or containers (e.g. running game emulators, firewall/VPN, home automatic, etc.) as well.
The good news is that enabling Hyper-V (for any reason) does not cause performance degradation – despite the virtualisation of the OS into the parent partition and despite the various vulnerability mitigations deployed for both OS and hypervisor. It is really great to see that all the benefits of virtualisation bring no performance loss.
Running tasks in a separate VM (with the same number of vCPUs as host threads) does mean slight performance degradation (5-10%). This should be acceptable if you need to keep those workloads completely separate for whatever reason (security, requiring old OS, requiring different OS, etc.). Let’s remember the parent partition is also running in this case (thus 2 VMs + hypervisor). [Ordinarily, you would not assign a VM as many threads as the host – but if you need to (especially on low core count hosts) – you can]
Adding additional complexity (running virtualised) can bring new issues mainly concerning 3rd-party device drivers (video, network, peripherals, etc.) that may throw new errors when running virtualised – however by this time most modern drivers would have been tested and certified to work in virtualised mode. It is possible that old device drivers may be problematic.
In conclusion we do not see any downside to enabling Hyper-V and the new security measures (Core Isolation, Memory Integrity, etc.) in Windows. You can also check out creating VMs, containers and playing with the new technology.
In a word: Recommended!
Please see our other articles on:
- Performance Impact of Hyper-V virtualisation (Windows 10 Pro) – Cache and Memory
- Performance Impact of Hyper-V virtualisation (Windows 10 Pro) – Storage
- Performance Impact of Hyper-V virtualisation (Windows 10 Pro) – Networking