What is “CofeeLake” CFL?
The 8th generation Intel Core architecture is code-named “CofeeLake” (CFL): unlike previous architectures, it is a minor stepping of the previous 7th generation “KabyLake” (KBL), itself a minor update of the 6th generation “SkyLake” (SKL). As before, the CPUs contain an integrated GPU (with compute support aka GPGPU).
While originally Intel integrated graphics were not much use – starting with SNB (“SandyBridge”) and especially its GPGPU-capable successor IVB (“IvyBridge”) the integrated graphics units made large progress, with HSW (“Haswell”) introducing powerful many compute units (GT3+) and esoteric L4 cache (eDRAM) versions (“CrystallWell) supporting high-end features like FP64 (native 64-bit floating-point support) and zero-copy CPU <> GPU transfers.
Alas, while the features remained, the higher-end versions (GT3, GT4e) never became mainstream and pretty much disappeared – except very high-end ULV/H SKUs with top-end desktop CPUs like 6700K, 8700K, etc. tested here stuck with the low-end GT2 versions. Perhaps nobody in their right mind would use such CPUs without a dedicated external (GP)GPU, it is still interesting to see how the GPU core has evolved in time.
Also let’s not forget that on the mobile platforms (either ULV/Y even H) most laptops/tablets do not have dedicated GPU and rely solely on integrated graphics – and here naturally UHD630 performance matters.
- Intel Core i7 8700K CofeeLake Review & Benchmarks – CPU 6-core/12-thread Performance
- Intel Core i7 8700K CofeeLake Review & Benchmarks – Memory Performance
Hardware Specifications
We are comparing the graphics units of to-of-the-range Intel CPUs with low-end dedicated cards to determine whether they are good enough for modest use, especially for compute (GPGPU) use supporting the CPU.
| GPGPU Specifications | Intel UHD 630 (8700K, 9900K) | Intel HD 530 (6700K) | nVidia GT 1030 | Comments | |
| Arch Chipset | GT2 / EV9.5 | GT2 / EV9 | GP108 / SM6.1 | UHD6xx is just a minor revision of the HD5xx video core. | |
| Cores (CU) / Threads (SP) | 24 / 192 | 24 / 192 | 3 / 384 | No change in core / SP units. | |
| ROPs / TMUs | 8 / 16 | 8 / 16 | 16 / 24 | No change in ROP/TMUs either. | |
| Speed (Min-Turbo) | 350-1200 | 350-1150 | 300-1.26-1.52 | Turbo speed is only slightly increased. | |
| Power (TDP) | 95W | 91W | 35W | TDP has gone up a bit but nothing major. | |
| Constant Memory | 3.2GB | 3.2GB | 64kB (dedicated) | There is no dedicated constant memory thus a large chunk is available to use (GB) unlike a dedicated video card with very fast but small (kB). | |
| Shared (Local) Memory | 64kB | 64kB | 48kB (dedicated) | Bigger than usual shared/local memory but slow (likely non dedicated). | |
| Global Memory | 7GB (of 16GB) | 7GB (of 16GB) | 2GB | About 50% of main memory can be used as global memory – thus pretty large workloads can be run. | |
| Memory System | DDR4 3200Mt/s 128-bit | DDR4 2533Mt/s 128-bit | GDDR5 6Gt/s 64-bit | CFL can reliably run at faster data rates thus 630 benefits too. | |
| Memory Bandwidth (GB/s) |
50 | 40 | 48 | The high data rate of DDR4 can result in higher bandwidth than some dedicated cards. | |
| L2 Cache | 512kB | 512kB | 48kB | L2 is unchanged and reasonably large. | |
| FP64/double ratio | Yes, 1/8 | Yes, 1/8 | Yes, 1/32 | FP64 is supported and at good ration compared to gimped dedicated cards. | |
| FP16/half ratio |
Yes, 2x | Yes, 2x | Yes, 1/64 | FP16 is also now supported at twice the rate – again unlike gimped dedicated cards. | |
Processing Performance
We are testing both OpenCL performance using the latest SDK / libraries / drivers from both Intel and competition.
Results Interpretation: Higher values (GOPS, MB/s, etc.) mean better performance.
Environment: Windows 10 x64, latest Intel drivers, OpenCL 2.x. Turbo / Boost was enabled on all configurations.
| Processing Benchmarks | Intel UHD 630 (8700K, 9900K) | Intel HD 530 (6700K) | nVidia GT 1030 | Comments | ||
 |
||||||
 |
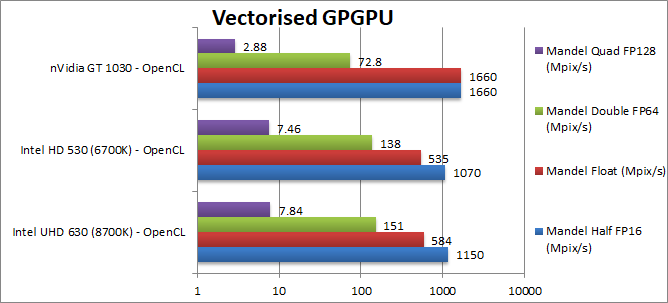
Mandel FP16/Half (Mpix/s) | 1150 [+7%] | 1070 | 1660 | Thanks to FP16 support we see double the performance over FP32 and thus only 50% slower than dedicated 1030. | |
|
Mandel FP32/Single (Mpix/s) | 584 [+9%] | 535 | 1660 | 630 is almost 10% faster than old 530 but still about 1/3 of a dedicated 1030. | |
|
Mandel FP64/Double (Mpix/s) | 151 [+9%] | 138 | 72.8 | FP64 sees a similar delta (+9%) but much faster (2x) than a dedicated 1030 due to gimped FP64 units. | |
|
Mandel FP128/Quad (Mpix/s) | 7.84 [+5%] | 7.46 | 2.88 | Emulated FP128 precision depends entirely on FP64 performance and much better (3x) than gimped dedicated. | |
| UHD630 is about 5-9% faster than 520, not much to celebrate – but due to native FP16 and especially FP64 support it can match or even overtake low-end dedicated GPUs – a pretty surprising result! If only we had more cores, it may actually be very much competitive. | ||||||
 |
||||||
 |
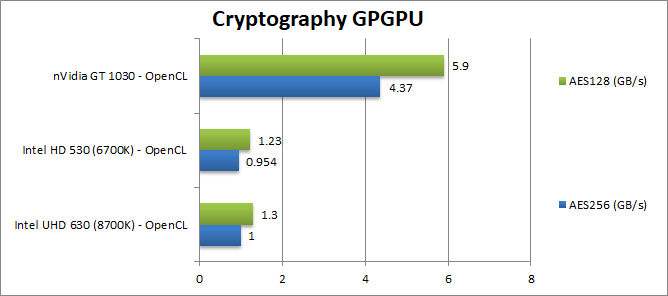
Crypto AES-256 (GB/s) | 1 [+5%] | 0.954 | 4.37 | We see a 5% improvement for 630 0 but far lower performance than a dedicated GPU. | |
|
Crypto AES-128 (GB/s) | 1.3 [+6] | 1.23 | 5.9 | Nothing changes here , we see a 6% improvement. | |
 |
||||||
|
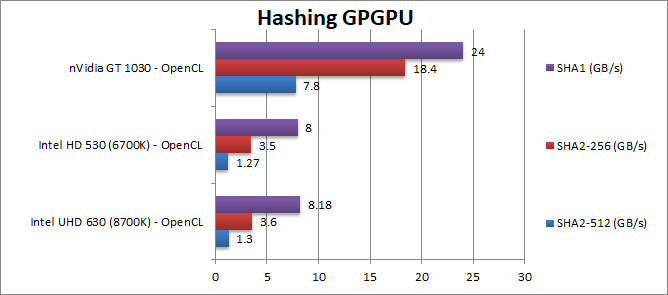
Crypto SHA2-256 (GB/s) | 3.6 [+3%] | 3.5 | 18.4 | In this heavy integer workload, the improvement falls to just 3% – but a dedicated unit would be about 4x faster. | |
|
Crypto SHA1 (GB/s) | 8.18 [+2%] | 8 | 24 | Nothing much changes here, we see a 2% improvement. | |
|
Crypto SHA2-512 (GB/s) | 1.3 [+2%] | 1.27 | 7.8 | With 64-bit integer workload, same improvement of just 2% but now the 1030 is about 6x faster! | |
| Nobody will be using integrated graphics for crypto-mining any time soon, we see a very minor improvement in 639 vs old 530, but overall low performance versus dedicated graphics like a 1030 which would be 4-6x faster. We would need 3x more cores to compete here. | ||||||
 |
||||||
 |
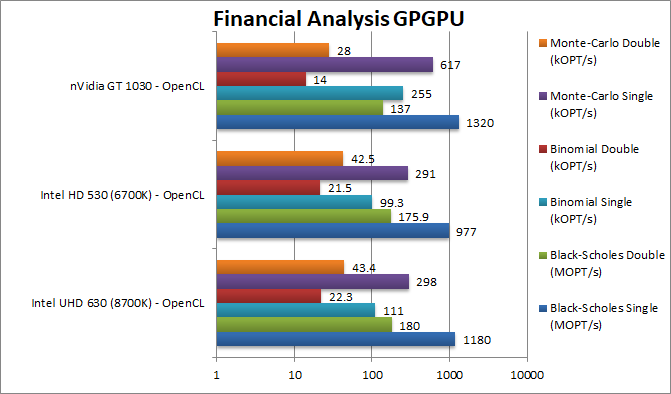
Black-Scholes float/FP32 (MOPT/s) | 1180 [+21%] | 977 | 1320 | In this FP32 financial workload we see a good 21% improvement vs. old 530. Also good result vs. dedicated 1030. | |
|
Black-Scholes double/FP64 (MOPT/s) | 180 [+2%] | 175 | 137 | Switching to FP64 code, the difference is next to nothing but better than a gimped 1030. | |
|
Binomial float/FP32 (kOPT/s) | 111 [+12%] | 99 | 255 | Binomial uses thread shared data thus stresses the internal memory sub-system, and here 630 is 12% faster. But 1/2 the performance of a 1030. | |
|
Binomial double/FP64 (kOPT/s) | 22.3 [+4%] | 21.5 | 14 | With FP64 code the improvement drops to 4%. | |
|
Monte-Carlo float/FP32 (kOPT/s) | 298 [+2%] | 291 | 617 | Monte-Carlo also uses thread shared data but read-only thus reducing modify pressure – strangely we see only 2% improvement and again 1/2 1030 performance. | |
|
Monte-Carlo double/FP64 (kOPT/s) | 43.4 [+2%] | 42.5 | 28 | Switching to FP64 we see no changes. But almost 2x performance over a 1030. | |
| You can run financial analysis algorithms with decent performance on an UHD630 – just as you could on the old 530 – and again better FP64 performance than dedicated – (GT 1030) a pretty impressive result. Naturally, you can just use the powerful CPU cores instead… | ||||||
 |
||||||
 |
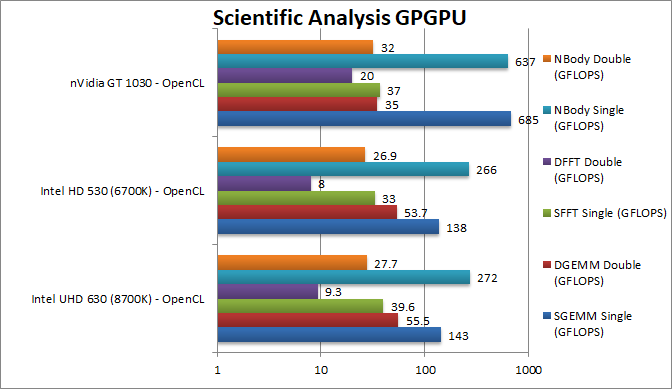
SGEMM (GFLOPS) float/FP32 | 143 [+4%] | 138 | 685 | Using 32-bit precision 630 improves 4% but is almost 1/5 (5 times slower) than a 1030. | |
|
DGEMM (GFLOPS) double/FP64 | 55.5 [+3%] | 53.7 | 35 | With FP64 precision, the delta does not change but now 640 is amost 2x faster than a 1030. | |
|
SFFT (GFLOPS) float/FP32 | 39.6 [+20%] | 33 | 37 | FFT is memory access bound and here 630’s faster DDR4 memory gives it a 20% lead. | |
|
DFFT (GFLOPS) double/FP64 | 9.3 [+16%] | 8 | 20 | We see a similar improvement with FP64 about 16%. | |
|
SNBODY (GFLOPS) float/FP32 | 272 [+2%] | 266 | 637 | Back to normality with this algorithm – we see just 2% improvement. | |
|
DNBODY (GFLOPS) double/FP64 | 27.7 [+3%] | 26.9 | 32 | With FP64 precision, nothing much changes. | |
| The scientific scores are similar to financial ones – except the memory access heavy FFT which greatly benefits from better memory (if that is provided of course) but this a dedicated card (like the 1030) is much faster in FP32 mode but again the 630 can be 2x faster in FP64 mode. Again, you’re much better off using the CPU and its powerful SIMD units for these algorithms. | ||||||
 |
||||||
 |
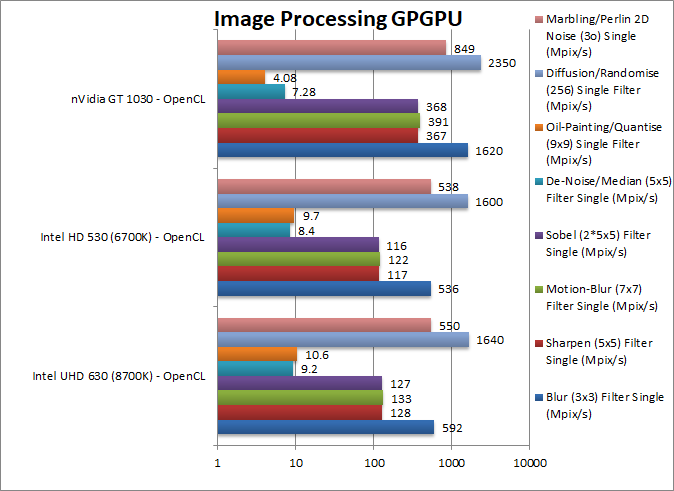
Blur (3×3) Filter single/FP32 (MPix/s) | 592 [+10%] | 536 | 1620 | In this 3×3 convolution algorithm, we see a 10% improvement over the old 530. But about 1/3x performance of a 1030. | |
|
Sharpen (5×5) Filter single/FP32 (MPix/s) | 128 [+9%] | 117 | 637 | Same algorithm but more shared data reduces the gap to 9%. | |
|
Motion Blur (7×7) Filter single/FP32 (MPix/s) | 133 [+9%] | 122 | 391 | With even more data the gap remains the same. | |
|
Edge Detection (2*5×5) Sobel Filter single/FP32 (MPix/s) | 127 [+9%] | 116 | 368 | Still convolution but with 2 filters – still 9% better. | |
|
Noise Removal (5×5) Median Filter single/FP32 (MPix/s) | 9.2 [+10%] | 8.4 | 7.3 | Different algorithm does not change much still 10% better. | |
|
Oil Painting Quantise Filter single/FP32 (MPix/s) | 10.6 [+9%] | 9.7 | 4.08 | Without major processing, 630 improves by the same amount. | |
|
Diffusion Randomise (XorShift) Filter single/FP32 (MPix/s) | 1640 [+2%] | 1600 | 2350 | This algorithm is 64-bit integer heavy thus we fall to the “usual” 2% improvement. | |
|
Marbling Perlin Noise 2D Filter single/FP32 (MPix/s) | 550 [+2%] | 538 | 849 | One of the most complex and largest filters, sees the same 2% improvement. | |
| For image processing using FP32 precision 630 performs a bit better than usual, 10% faster across the board compared to the old 530 – but still about 1/3 (third) the speed of a dedicated 1030. But if you can make do with FP16 precision image processing, then we almost double performance. | ||||||
Memory Performance
We are testing both OpenCL performance using the latest SDK / libraries / drivers from both Intel and competition.
Results Interpretation: Higher values (MB/s, etc.) mean better performance. Lower time values (ns, etc.) mean better performance.
Environment: Windows 10 x64, latest Intel drivers, OpenCL 2.x. Turbo / Boost was enabled on all configurations.
| Memory Benchmarks | Intel UHD 630 (8700K, 9900K) | Intel HD 530 (6700K) | nVidia GT 1030 | Comments | ||
 |
||||||
 |
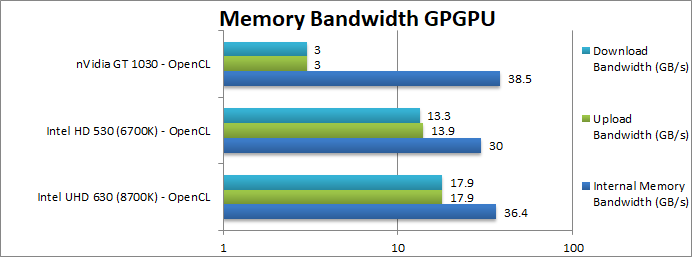
Internal Memory Bandwidth (GB/s) | 36.4 [+21%] | 30 | 38.5 | Due to higher speed DDR4 memory, the 630 manages 21% better bandwidth than the 620 – and comparable to a 64-bit bus dedicated card. | |
|
Upload Bandwidth (GB/s) | 17.9 [+29%] | 13.9 | 3 (PCIe3 x4) | The CPU<>GPU internal link seems to have 30% more bandwidth – naturally zero transfers are also supported. And a lot better than a dedicated card on PCIe3 x4 (4 lanes). | |
|
Download Bandwidth (GB/s) | 17.9 [+35%] | 13.3 | 3 (PCIe3 x4) | Here again we see a good 35% bandwidth improvement. | |
| CFL’s higher (stable) memory speed support improves bandwidth between 20-35% – which is likely behind most benchmark improvement in the compute algorithms above. However, that will only happen if high-speed DDR4 memory (3200 or faster) were to be used – an expensive proposition! eDRAM would greatly help here… | ||||||
 |
||||||
 |
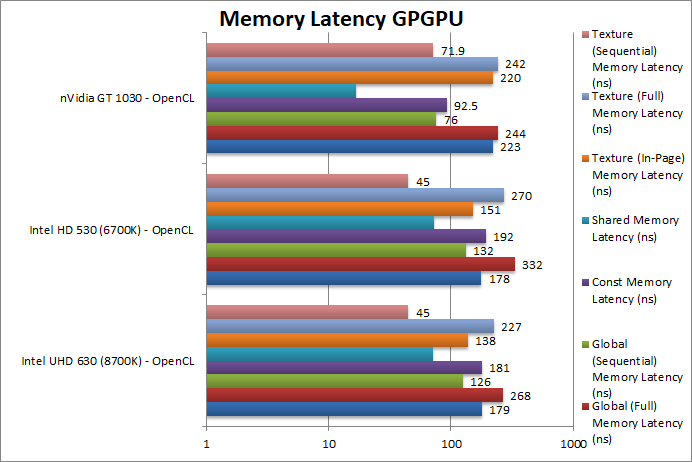
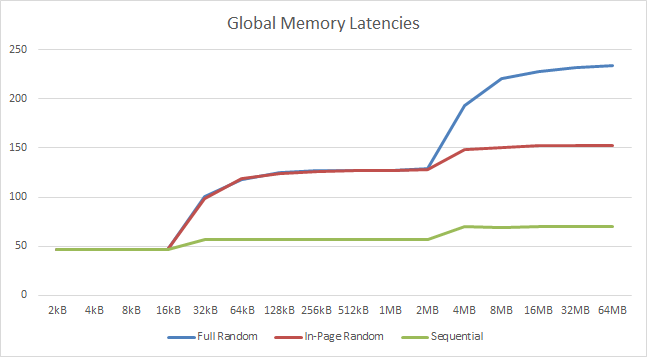
Global (In-Page Random Access) Latency (ns) | 179 [+1%] | 178 | 223 | No changes in global latencies in-page showing no memory sub-system improvements. | |
|
Global (Full Range Random Access) Latency (ns) | 268 [-19%] | 332 | 244 | Due to faster memory clock (even with slightly increased timings) full random access latencies fall by 20% (similar to bandwidth increase). | |
|
Global (Sequential Access) Latency (ns) | 126 [-5%] | 132 | 76 | Sequential access latencies do fall by a minor 5% as well though. | |
|
Constant Memory (In-Page Random Access) Latency (ns) | 181 [-6%] | 192 | 92.5 | Intel’s GPGPU don’t have dedicated constant memory thus we see similar performance to global memory. | |
|
Shared Memory (In-Page Random Access) Latency (ns) | 72 [-1%] | 73 | 16.6 | Shared memory latency is unchanged – and quite slow compared to architectures from competitors like the 1030. | |
|
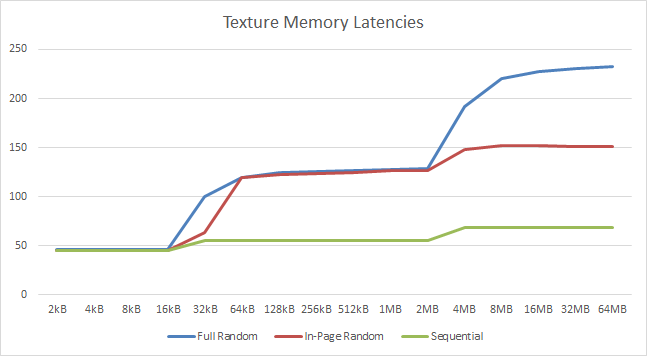
Texture (In-Page Random Access) Latency (ns) | 138 [-9%] | 151 | 220 | Texture access latencies do seem to show a 9% improvement a surprising result. | |
|
Texture (Full Range Random Access) Latency (ns) | 227 [-16%] | 270 | 242 | Just as we’ve seen with global (full range access) latencies, we see the best improvement about 16% here. | |
|
Texture (Sequential Access) Latency (ns) | 45 [=] | 45 | 71.9 | With sequential access we see no improvement. | |
| Anything to do with main memory access (aka “full random access”) does show a similar improvement to bandwidth increases, i.e. between 16-19% due to higher speed (but somewhat higher timings) main memory. All other access patterns show little to no improvements. | ||||||
 |
||||||
 |
||||||
When using higher speed DDR4 memory – as we do here (3200 vs 2533) UHD630 shows a good improvement in both bandwidth and reduced latencies – but otherwise it performs just the same as the old HD520 – not a surprise really. At least you can see that your (expensive) memory investment does not go to waste – with memory bound algorithms showing good improvement.
SiSoftware Official Ranker Scores
Final Thoughts / Conclusions
For GPGPU workloads, UHD630 does not bring anything new – it performs similarly to the old HD520. But as CFL can use higher (stable) memory, bandwidth and latencies are improved (when using such higher speed memory) and thus most algorithms do show good improvements. Naturally as long as you can afford to provide such memory.
The surprising support for 1/2 ratio native FP64 support means 64-bit floating-point algorithms can run faster than on a typical low-end graphics card (as despite also supporting native FP64 the ratio is 1/32 vs. FP32 rate) so high accuracy workloads do work well on it. If loss of accuracy is OK (e.g. picture processing) native FP16 support at 2x rate makes such algorithms almost 2x faster and thus within the performance of a typical low-end graphics card (that either don’t support FP16 or their ratio is 1/64!).
As we touched in the introduction – this may not matter on desktop – but on mobile where most laptops/tablets use the integrated graphics any and all such improvements can make a big difference. While in the past the fast-improving EV cores became performance competitive with CPU cores (as there were only 2 ULV ones) – with CFL doubling number of CPU cores (4 vs. 2) it is likely that internal graphics (GPGPU) performance is now too low.
We’re sad that the GT3/GT4 versions are not common-place not to mention the L4/eDRAM which showed so much promise in the HSW days.
But Intel has recently revamped its GPU division and are committed to release dedicated (not just internal) graphics in a few years (2020?) which hopefully means we should see far more powerful GPUs from them soon.
Let’s hope they do see the light-of-day and are not cancelled like the “Phi” GPGPU accelerators (“Knights Landing”) which showed so much promise but somehow never made it outside data centres before sailing into the sunset…