What is “CofeeLake” CFL?
The 8th generation Intel Core architecture is code-named “CofeeLake” (CFL): unlike previous architectures, it is a minor stepping of the previous 7th generation “KabyLake” (KBL), itself a minor update of the 6th generation “SkyLake” (SKL). The server/workstation (SKL-X/KBL-X) CPU core saw new instruction set support (AVX512) as well as other improvements – these have not made the transition yet.
Possibly due limited competition (before AMD Ryzen launch), process issues (still at 14nm) and the disclosure of a whole host of hardware vulnerabilities (Spectre, Meltdown, etc.) which required microcode (firmware) updates – performance improvements have not been forthcoming. This is pretty much unprecedented – while some Core updates were only evolutionary we have not had complete stagnation before; in addition the built-in GPU core has also remained pretty much stagnant – we will investigate this in a subsequent article.
However, CFL does bring up a major change – and that is increased core counts both on desktop and mobile: on desktop we go from 4 to 6 cores (+50%) while on mobile (ULV) we go from 2 to 4 (+100%) within the same TDP envelope!
While this article is a bit late in the day considering the 8700K launched last year – we have now also reviewed the brand-new CofeeLake-R (Refresh) Core i9-9900K and it seems a good time to see what has changed performance-wise for the previous top-of-the-range CPU.
In this article we test CPU Core performance; please see our other articles on:
- Intel Core i7 8700K CofeeLake Review & Benchmarks – Cache & Memory Performance
- Intel Core i7 8700K CofeeLake Review & Benchmarks – GPGPU (UHD 630) Performance
- Intel Core i9 9900K CofeeLake-R Review & Benchmarks – 2-channel DDR4 Cache & Memory Performance
Hardware Specifications
We are comparing the top-of-the-range Gen 8 Core i7 (8700K) with previous generation (6700K) and competing architectures with a view to upgrading to a mid-range high performance design.
| CPU Specifications | Intel i7-8700K CofeeLake |
AMD Ryzen2 2700X Pinnacle Ridge |
Intel i9-7900X SkyLake-X |
Intel i7-6700K SkyLake |
Comments | |
| Cores (CU) / Threads (SP) | 6C/12T | 8C / 16T | 10C / 20T | 4C / 8T | We have 50% more cores compared to SKL/KBL but still not as much as Ryzen/2 with 8 cores. | |
| Speed (Min / Max / Turbo) | 0.8-3.7-4.7GHz (8x-37x-47x) | 2.2-3.7-4.2GHz (22x-37x-42x) | 1.2-3.3-4.3 (12x-33x-43x) | 0.8-4.0-4.2GHz (8x-40x-42x) | Single-core Turbo has increased close to 5GHz (reserved for Special Edition 8086K) way above SKL/KBL and Ryzen. | |
| Power (TDP) | 95W (131) | 105W (135) | 140W (308) | 91W (100) | TDP has only increased by 4% and is still below Ryzen though Turbo is comparable. | |
| L1D / L1I Caches | 6x 32kB 8-way / 6x 32kB 8-way | 8x 32kB 8-way / 8x 64kB 8-way | 10x 32kB 8-way / 10x 32kB 8-way | 4x 32kB 8-way / 4x 32kB 8-way | No change in L1 caches. Just more of them. | |
| L2 Caches | 6x 256kB 8-way | 8x 512kB 8-way | 10x 1MB 8-way | 4x 256kB 8-way | No change in L2 caches. Just more of them. | |
| L3 Caches | 12MB 16-way | 2x 8MB 16-way | 13.75MB 11-way | 8MB 16-way | L3 has also increased by 50% in line with cores, but still below Ryzen’s 16MB. | |
| Microcode/Firmware | MU069E0A-96 | MU8F0802-04 | MU065504-49 | MU065E03-C2 | We have a new model and somewhat newer microcode. | |
Native Performance
We are testing native arithmetic, SIMD and cryptography performance using the highest performing instruction sets (AVX2, AVX, etc.). CFL supports most modern instruction sets (AVX2, FMA3) but not the latest SKL/KBL-X AVX512 nor a few others like SHA HWA (Atom, Ryzen).
Results Interpretation: Higher values (GOPS, MB/s, etc.) mean better performance.
Environment: Windows 10 x64 (1807), latest drivers. 2MB “large pages” were enabled and in use. Turbo / Boost was enabled on all configurations.
Spectre / Meltdown Windows Mitigations: all were enabled as per default (BTI enabled, RDCL/KVA enabled, PCID enabled).
| Native Benchmarks | Intel i7-8700K CofeeLake | AMD Ryzen2 2700X Pinnacle Ridge | Intel i9-7900X SkyLake-X | Intel i7-6700K SkyLake | Comments | |
 |
||||||
 |
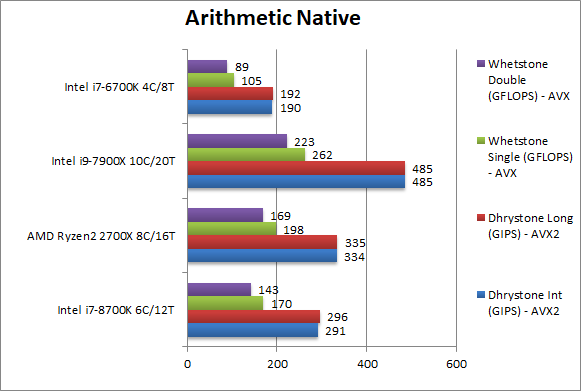
Native Dhrystone Integer (GIPS) | 291 [-13%] | 334 | 485 | 190 | In the old Drystone integer workload, CFL is still 13% slower than Ryzen 2 depite the huge lead over SKL. |
|
Native Dhrystone Long (GIPS) | 296 [-12%] | 335 | 485 | 192 | With a 64-bit integer workload – nothing much changes. |
|
Native FP32 (Float) Whetstone (GFLOPS) | 170 [-14%] | 198 | 262 | 105 | Switching to floating-point, CFL is still 14% slower in the old Whetstone also a micro-benchmark. |
|
Native FP64 (Double) Whetstone (GFLOPS) | 143 [-15%] | 169 | 223 | 89 | With FP64 nothing much changes. |
| From integer workloads in Dhyrstone to floating-point workloads in Whestone, CFL is still 12-15% slower than Ryzen 2 with its 2 more cores (8 vs. 2), but much faster than the old SKL with 4 cores. We begin to see now why Intel is adding more cores in CFL-R. | ||||||
 |
||||||
 |
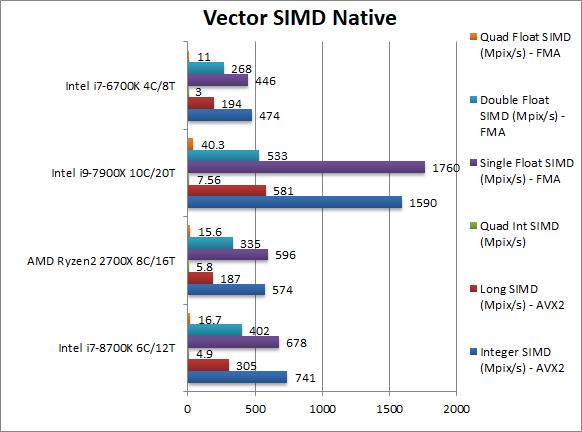
Native Integer (Int32) Multi-Media (Mpix/s) | 741 [+29%] | 574 | 1590 (AVX512) | 474 | In this vectorised AVX2 integer test we see CFL beating Ryzen by ~30% despite less cores. |
|
Native Long (Int64) Multi-Media (Mpix/s) | 305 [+63%] | 187 | 581 (AVX512) | 194 | With a 64-bit AVX2 integer vectorised workload, CFL is now 63% faster. |
|
Native Quad-Int (Int128) Multi-Media (Mpix/s) | 4.9 [-16%] | 5.8 | 7.6 | 3 | This is a tough test using Long integers to emulate Int128 without SIMD: Ryzen 2 thus wins this one with CFL slower by 16%. |
|
Native Float/FP32 Multi-Media (Mpix/s) | 678 [+14%] | 596 | 1760 (AVX512) | 446 | In this floating-point AVX/FMA vectorised test, CFL is again 14% faster. |
|
Native Double/FP64 Multi-Media (Mpix/s) | 402 [+20%] | 335 | 533 (AVX512) | 268 | Switching to FP64 SIMD code, CFL is again 20% faster. |
|
Native Quad-Float/FP128 Multi-Media (Mpix/s) | 16.7 [+7%] | 15.6 | 40.3 (AVX512) | 11 | In this heavy algorithm using FP64 to mantissa extend FP128 but not vectorised – CFL is just 7% faster but does win. |
| In vectorised SIMD code we see the power of Intel’s SIMD units that can execute 256-bit instructions in one go; CFL soundly beats Ryzen2 despite fewer cores (7-60%). SKL-X shows that AVX512 brings further gains and is a pity CFL still does not support them. | ||||||
 |
||||||
 |
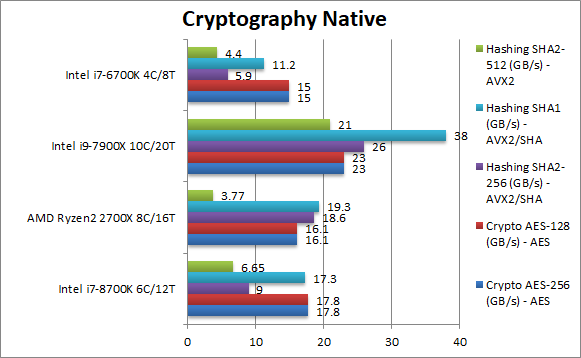
Crypto AES-256 (GB/s) | 17.8 [+11%] | 16.1 | 23 | 15 | With AES HWA support all CPUs are memory bandwidth bound; unfortunately Ryzen 2 is at 2667 vs CFL/SKL-X at 3200 which means CFL is 11% faster. |
|
Crypto AES-128 (GB/s) | 17.8 [+11%] | 16.1 | 23 | 15 | What we saw with AES-256 just repeats with AES-128. |
|
Crypto SHA2-256 (GB/s) | 9 [-51%] | 18.6 | 26 (AVX512) | 5.9 | With SHA HWA Ryzen2 similarly powers through hashing tests leaving Intel in the dust; CFL is thus 50% slower. |
|
Crypto SHA1 (GB/s) | 17.3 [-9%] | 19.3 | 38 (AVX512) | 11.2 | Ryzen also accelerates the soon-to-be-defunct SHA1 but the algorithm is less compute heavy thus CFL is only 9% slower. |
|
Crypto SHA2-512 (GB/s) | 6.65 [+77%] | 3.77 | 21 (AVX512) | 4.4 | SHA2-512 is not accelerated by SHA HWA, allowing CFL to use its SIMD units and be 77% faster. |
| AES HWA is memory bound and here CFL comfortably works with 3200Mt/s memory thus is faster than Ryzen 2 with 2667Mt/s memory (our sample); likely both would score similarly at 3200Mt/s. Ryzen 2 SHA HWA allows it to easily beat all other CPUs but only in SHA1/SHA256 – in others the CFL SIMD units win the day. | ||||||
 |
||||||
 |
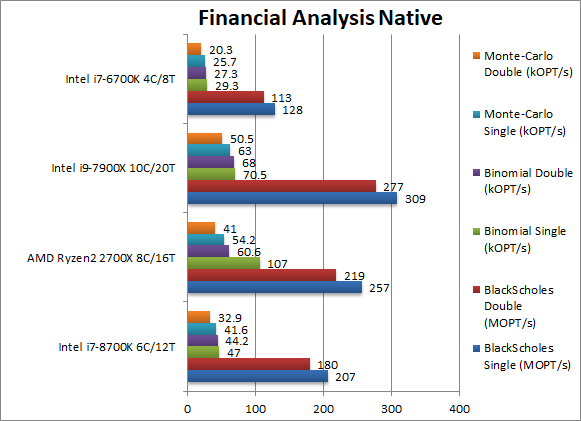
Black-Scholes float/FP32 (MOPT/s) | 207 [-19%] | 257 | 309 | 128 | In this non-vectorised test CFL cannot match Ryzen 2 and is ~20% slower. |
|
Black-Scholes double/FP64 (MOPT/s) | 180 [-18%] | 219 | 277 | 113 | Switching to FP64 code, nothing much changes, Ryzen 2 is still faster. |
|
Binomial float/FP32 (kOPT/s) | 47 [-56%] | 107 | 70.5 | 29.3 | Binomial uses thread shared data thus stresses the cache & memory system; Ryzen 2 does very well here with CFL almost 60% slower. |
|
Binomial double/FP64 (kOPT/s) | 44.2 [-27%] | 60.6 | 68 | 27.3 | With FP64 code Ryzen2’s lead diminishes, CFL is “only” 27% slower. |
|
Monte-Carlo float/FP32 (kOPT/s) | 41.6 [-23%] | 54.2 | 63 | 25.7 | Monte-Carlo also uses thread shared data but read-only thus reducing modify pressure on the caches; Ryzen 2 also wins this one, CFL is 23% slower. |
|
Monte-Carlo double/FP64 (kOPT/s) | 32.9 [-20%] | 41 | 50.5 | 20.3 | Switching to FP64 nothing much changes, CFL is still 20% slower. |
| Without SIMD support, CFL loses to Ryzen 2 as we saw with Dhrystone/Whetstone – between 20 and 50%. As we noted before, Intel will still need to add more cores in order to beat Ryzen 2. Still big improvement over the old SKL/KBL as expected. | ||||||
 |
||||||
 |
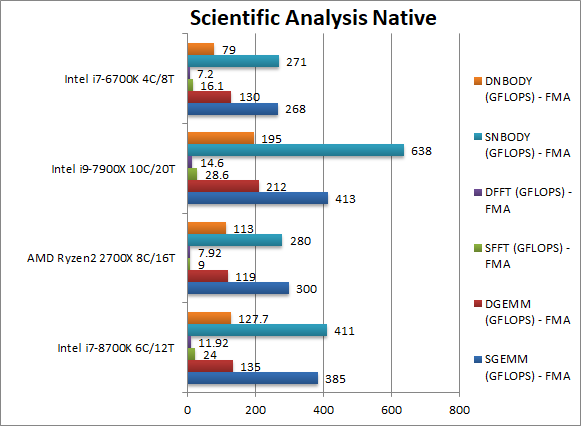
SGEMM (GFLOPS) float/FP32 | 385 [+28%] | 300 | 413 (AVX512) | 268 | In this tough vectorised AVX2/FMA algorithm CFL is ~30% faster. |
|
DGEMM (GFLOPS) double/FP64 | 135 [+13%] | 119 | 212 (AVX512) | 130 | With FP64 vectorised code, CFL’s lead reduces to 13% over Ryzen 2. |
|
SFFT (GFLOPS) float/FP32 | 24 [167%] | 9 | 28.6 (AVX512) | 16.1 | FFT is also heavily vectorised (x4 AVX/FMA) but stresses the memory sub-system more; here CFL is over 2.5x faster |
|
DFFT (GFLOPS) double/FP64 | 11.9 [+51%] | 7.92 | 14.6 (AVX512) | 7.2 | With FP64 code, CFL’s lead reduces to ~50%. |
|
SNBODY (GFLOPS) float/FP32 | 411 [+47%] | 280 | 638 (AVX512) | 271 | N-Body simulation is vectorised but many memory accesses to shared data but CFL remains ~50% faster. |
|
DNBODY (GFLOPS) double/FP64 | 127 [+13%] | 113 | 195 (AVX512) | 79 | With FP64 code CFL’s lead reduces to 13% over Ryzen 2. |
| With highly vectorised SIMD code CFL performs well soundly beating Ryzen 2 between 13-167% as well as significantly improving over older SKL/KBL. As long as SIMD code is used Intel has little to fear. | ||||||
 |
||||||
 |
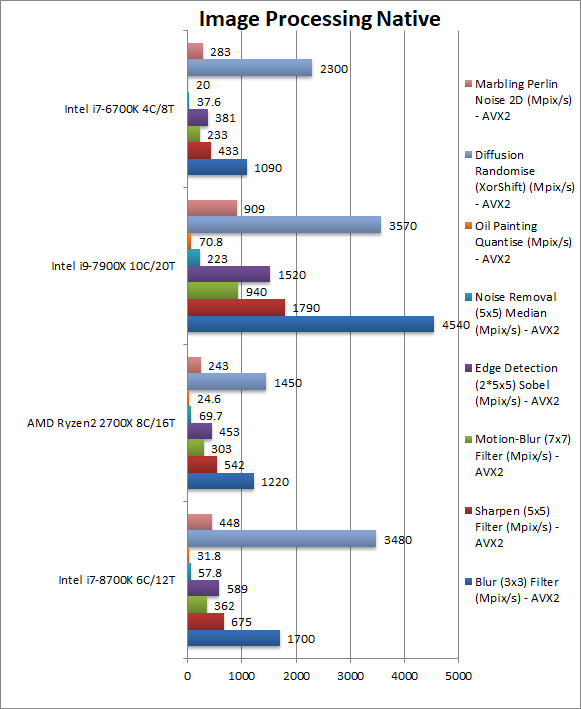
Blur (3×3) Filter (MPix/s) | 1700 [+39%] | 1220 | 4540 (AVX512) | 1090 | In this vectorised integer AVX2 workload CFL enjoys a ~40% lead over Ryzen 2. |
|
Sharpen (5×5) Filter (MPix/s) | 675 [+25%] | 542 | 1790 (AVX512) | 433 | Same algorithm but more shared data reduces the lead to 25% still significant. |
|
Motion-Blur (7×7) Filter (MPix/s) | 362 [+19%] | 303 | 940 (AVX512) | 233 | Again same algorithm but even more data shared reduces the lead to 20%. |
|
Edge Detection (2*5×5) Sobel Filter (MPix/s) | 589 [+30%] | 453 | 1520 (AVX512) | 381 | Different algorithm but still AVX2 vectorised workload means CFL is 30% faster than Ryzen 2. |
|
Noise Removal (5×5) Median Filter (MPix/s) | 57.8 [-17%] | 69.7 | 223 (AVX512) | 37.6 | Still AVX2 vectorised code but CFL stumbles a bit here – it’s 17% slower than Ryzen 2. |
|
Oil Painting Quantise Filter (MPix/s) | 31.8 [+29%] | 24.6 | 70.8 (AVX512) | 20 | Again we see CFL ~30% faster. |
|
Diffusion Randomise (XorShift) Filter (MPix/s) | 3480 [+140%] | 1450 | 3570 (AVX512) | 2300 | CFL (like all Intel CPUs) does very well here – it’s a huge 140% faster. |
|
Marbling Perlin Noise 2D Filter (MPix/s) | 448 [+84%] | 243 | 909 (AVX512) | 283 | In this final test, CFL is almost 2x faster than Ryzen 2. |
The addition of 2 more cores brings big performance gains (not to mention the higher Turbo clock) over the old SKL/KBL which is pretty impressive considering TDP has stayed the same. With SIMD code (AVX/AVX2/FMA3) CFL has no problem beating Ryzen 2 by a pretty large margin (up to 2x faster) – but any algorithm not vectorised allows Ryzen 2 to win – though not by much 12-20%.
Streaming tests likely benefit from the higher supported memory frequencies that while in theory could be used on the older SKL/KBL (memory overclock) they were not supported officially nor stable in all cases. We shall test memory performance in a forthcoming article.
Software VM (.Net/Java) Performance
We are testing arithmetic and vectorised performance of software virtual machines (SVM), i.e. Java and .Net. With operating systems – like Windows 10 – favouring SVM applications over “legacy” native, the performance of .Net CLR (and Java JVM) has become far more important.
Results Interpretation: Higher values (GOPS, MB/s, etc.) mean better performance.
Environment: Windows 10 x64 (1807), latest drivers. 2MB “large pages” were enabled and in use. Turbo / Boost was enabled on all configurations.
Spectre / Meltdown Windows Mitigations: all were enabled as per default (BTI enabled, RDCL/KVA enabled, PCID enabled).
| VM Benchmarks | Intel i7-8700K CofeeLake | AMD Ryzen2 2700X Pinnacle Ridge | Intel i9-7900X SkyLake-X | Intel i7-6700K SkyLake | Comments | |
 |
||||||
 |
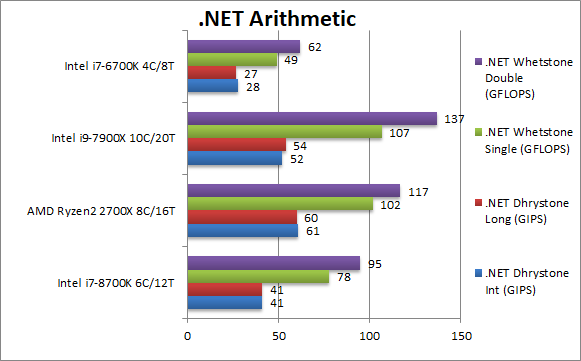
.Net Dhrystone Integer (GIPS) | 41 [-33%] | 61 | 52 | 28 | .Net CLR integer performance starts off well over old SKL but still 33% slower than Ryzen 2. |
|
.Net Dhrystone Long (GIPS) | 41 [-32%] | 60 | 54 | 27 | With 64-bit integers nothing much changes. |
|
.Net Whetstone float/FP32 (GFLOPS) | 78 [-24%] | 102 | 107 | 49 | Floating-Point CLR performance does not change much, CFL is still 25% slower than Ryzen despite big gain over old SKL. |
|
.Net Whetstone double/FP64 (GFLOPS) | 95 [-19%] | 117 | 137 | 62 | FP64 performance is similar to FP32. |
| Ryzen 2 performs exceedingly well in .Net workloads – soundly beating all Intel CPUs, with CFL between 20-33% slower. More cores will be needed for parity with Ryzen 2, but at least CFL improves a lot over SKL/KBL. | ||||||
 |
||||||
 |
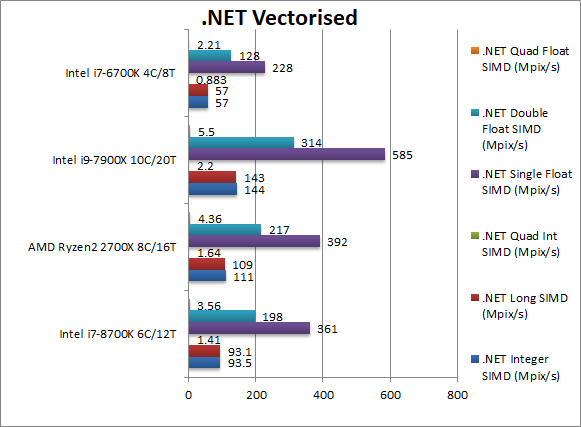
.Net Integer Vectorised/Multi-Media (MPix/s) | 93.5 [-16%] | 111 | 144 | 57 | Just as we saw with Dhrystone, this integer workload sees CFL improve greatly over SKL but Ryzen 2 is still faster. |
|
.Net Long Vectorised/Multi-Media (MPix/s) | 93.1 [-15%] | 109 | 143 | 57 | With 64-bit integer workload nothing much changes. |
|
.Net Float/FP32 Vectorised/Multi-Media (MPix/s) | 361 [-8%] | 392 | 585 | 228 | Here we make use of RyuJit’s support for SIMD vectors thus running AVX/FMA code but CFL is still 8% slower than Ryzen 2. |
|
.Net Double/FP64 Vectorised/Multi-Media (MPix/s) | 198 [-9%] | 217 | 314 | 128 | Switching to FP64 SIMD vector code – still running AVX/FMA – CFL is still slower. |
| We see a similar improvement for CFL but again not enough to beat Ryzen 2; even using RyuJit’s vectorised support CFL cannot beat it – just reduce the loss to 8-9%. | ||||||
 |
||||||
 |
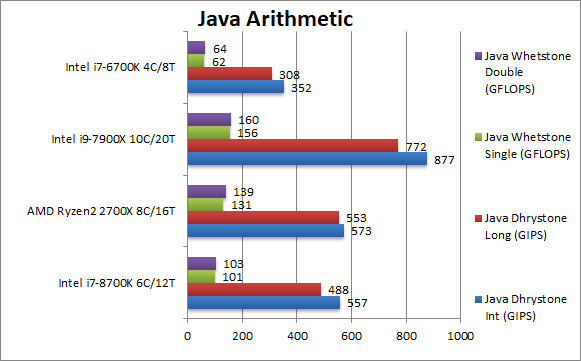
Java Dhrystone Integer (GIPS) | 557 [-3%] | 573 | 877 | 352 | Java JVM performance is almost neck-and-neck with Ryzen 2 despite 2 less cores. |
|
Java Dhrystone Long (GIPS) | 488 [-12%] | 553 | 772 | 308 | With 64-bit integers, CFL does fall behind Ryzen2 by 12%. |
|
Java Whetstone float/FP32 (GFLOPS) | 101 [-23%] | 131 | 156 | 62 | Floating-point JVM performance is worse though, CFL is now 23% slower. |
|
Java Whetstone double/FP64 (GFLOPS) | 103 [-26%] | 139 | 160 | 64 | With 64-bit precision nothing much changes. |
| While CFL improves markedly over the old SKL and almost ties with Ryzen 2 in integer workloads, it does fall behind in floating-point by a good amount. | ||||||
 |
||||||
 |
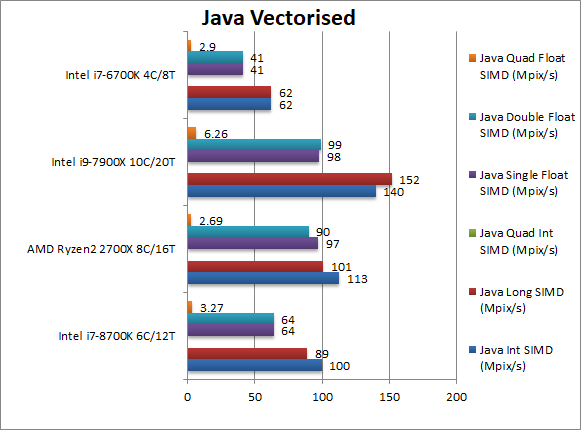
Java Integer Vectorised/Multi-Media (MPix/s) | 100 [-12%] | 113 | 140 | 63 | Without SIMD acceleration we see the usual delta (around 12%) with integer workload. |
|
Java Long Vectorised/Multi-Media (MPix/s) | 89 [-12%] | 101 | 152 | 62 | Nothing changes when changing to 64-bit integer workloads. |
|
Java Float/FP32 Vectorised/Multi-Media (MPix/s) | 64 [-34%] | 97 | 98 | 41 | With floating-point non-SIMD accelerated we see a bigger delta of about 30% less vs. Ryzen 2. |
|
Java Double/FP64 Vectorised/Multi-Media (MPix/s) | 64 [-29%] | 90 | 99 | 41 | With 64-bit floatint-point precision nothing much changes. |
| With compute heavy vectorised code but not SIMD accelerated, CFL cannot keep up with Ryzen 2 and the difference increases to about 30% less. Intel really needs to get Oracle to add SIMD extensions similar to .Net’s new CLR. | ||||||
Ryzen dominates .Net and Java benchmarks – Intel will need more cores in order to compete; while the additional 2 cores helped a lot, it is not enough!
SiSoftware Official Ranker Scores
Final Thoughts / Conclusions
Due to Core improvement stagnation (4 on desktop, 2 on mobile), Intel had no choice really but increase core counts in light of new competition from AMD with Ryzen/2 with twice as many cores (8) and SMT (Hyper-Threading) as well! While KBL had increased base/Turbo cores appreciably over SKL within the same power envelope, CFL had to add more cores in order to compete.
With 50% more cores (6) CFL performs much better than the older SKL/KBL as expected but that is not enough in non-vectorised loads; Ryzen 2 with 2 more cores is still faster, not by much (12-20%) but still faster. Once vectorised code is used, the power of Intel’s SIMD units shows – with CFL soundly beating Ryzen despite not supporting AVX512 nor SHA HWA which is a pity. AMD still has work to do with Ryzen if it wants to be competitive in vectorised workloads (integer or floating-point).
We now see why CFL-R (CofeeLake Refresh) will add even more cores (8C/16T with 9900K which we review in a subsequent article) – it is the only way to beat Ryzen 2 in all workloads. In effect AMD’s has reached parity performance with Intel in all but SIMD workloads – a great achievement!
Unfortunately (unlike AMD’s AM4 Ryzen) CFL does require new chipset/boards (series 300) which makes it an expensive upgrade for SKL/KBL owners; otherwise it would have been a pretty no-brainer upgrade for those needing more compute power. While the new platform does bring some improvements (USB 3.1 Gen 2 aka 10GB/s, more PCIe lanes, integrated 802.11ac WiFi – at least on mobile) it’s nothing over the competition.
Roll on CofeeLake Refresh and the new CPUs: they are sorely needed…